Spotify Results Presentation Deck
Executive Summary
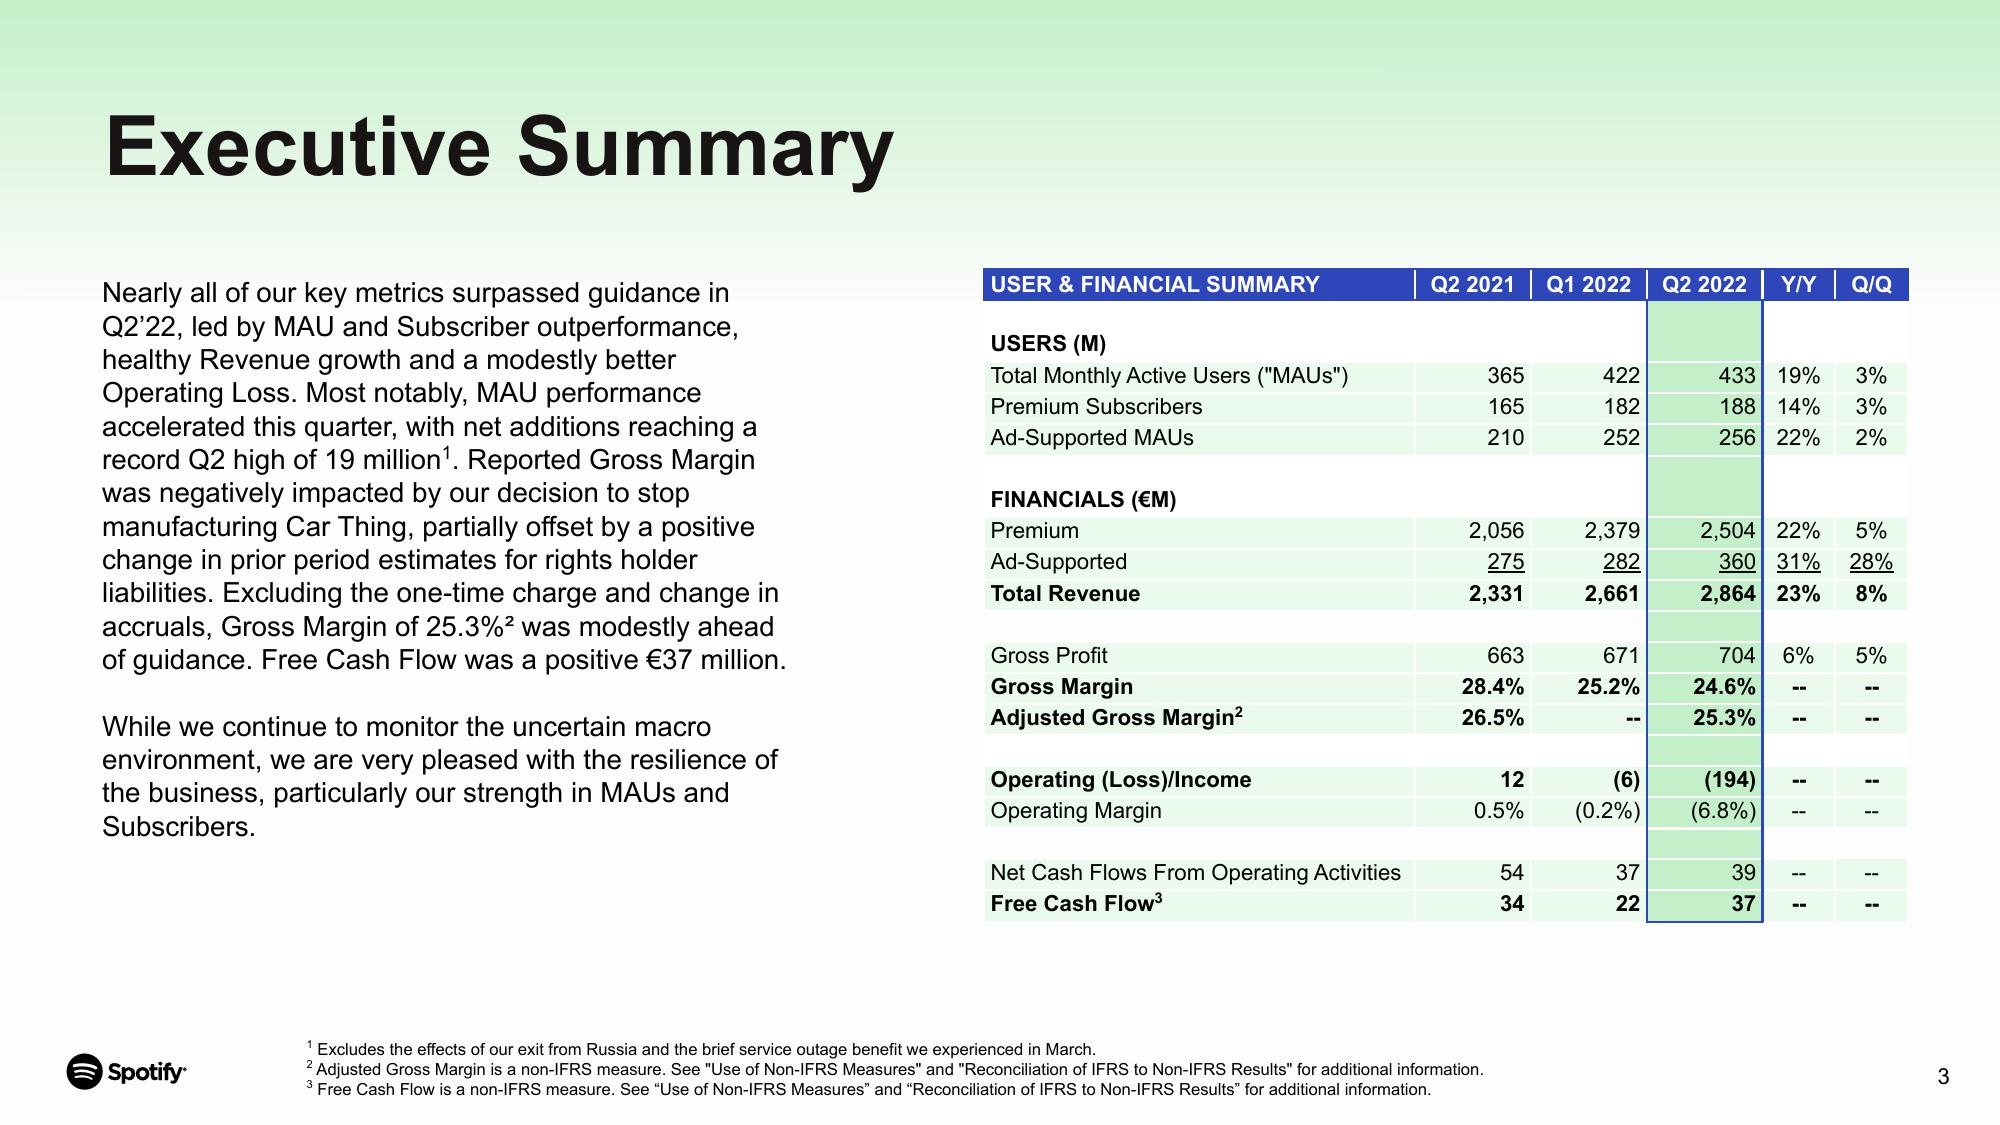
Nearly all of our key metrics surpassed guidance in
Q2'22, led by MAU and Subscriber outperformance,
healthy Revenue growth and a modestly better
Operating Loss. Most notably, MAU performance
accelerated this quarter, with net additions reaching a
record Q2 high of 19 million¹. Reported Gross Margin
was negatively impacted by our decision to stop
manufacturing Car Thing, partially offset by a positive
change in prior period estimates for rights holder
liabilities. Excluding the one-time charge and change in
accruals, Gross Margin of 25.3%² was modestly ahead
of guidance. Free Cash Flow was a positive €37 million.
While we continue to monitor the uncertain macro
environment, we are very pleased with the resilience of
the business, particularly our strength in MAUs and
Subscribers.
Spotify
USER & FINANCIAL SUMMARY
USERS (M)
Total Monthly Active Users ("MAUS")
Premium Subscribers
Ad-Supported MAUS
FINANCIALS (EM)
Premium
Ad-Supported
Total Revenue
Gross Profit
Gross Margin
Adjusted Gross Margin²
Operating (Loss)/Income
Operating Margin
Net Cash Flows From Operating Activities
Free Cash Flow³
Q2 2021 Q1 2022
365
165
210
2,056
275
2,331
663
28.4%
26.5%
12
0.5%
1 Excludes the effects of our exit from Russia and the brief service outage benefit we experienced in March.
2 Adjusted Gross Margin is a non-IFRS measure. See "Use of Non-IFRS Measures" and "Reconciliation of IFRS to Non-IFRS Results" for additional information.
3 Free Cash Flow is a non-IFRS measure. See "Use of Non-IFRS Measures" and "Reconciliation of IFRS to Non-IFRS Results" for additional information.
54
34
422
182
252
2,379
282
2,661
671
25.2%
Q2 2022
37
22
433 19%
188 14%
256 22%
Y/Y Q/Q
2,504 22%
360 31%
2,864 23%
(6) (194)
(0.2%) (6.8%)
704 6%
24.6%
25.3%
39
37
--
--
11
--
3%
3%
2%
5%
28%
8%
5%
3View entire presentation