Squarespace Investor Day Presentation Deck
INVESTOR DAY
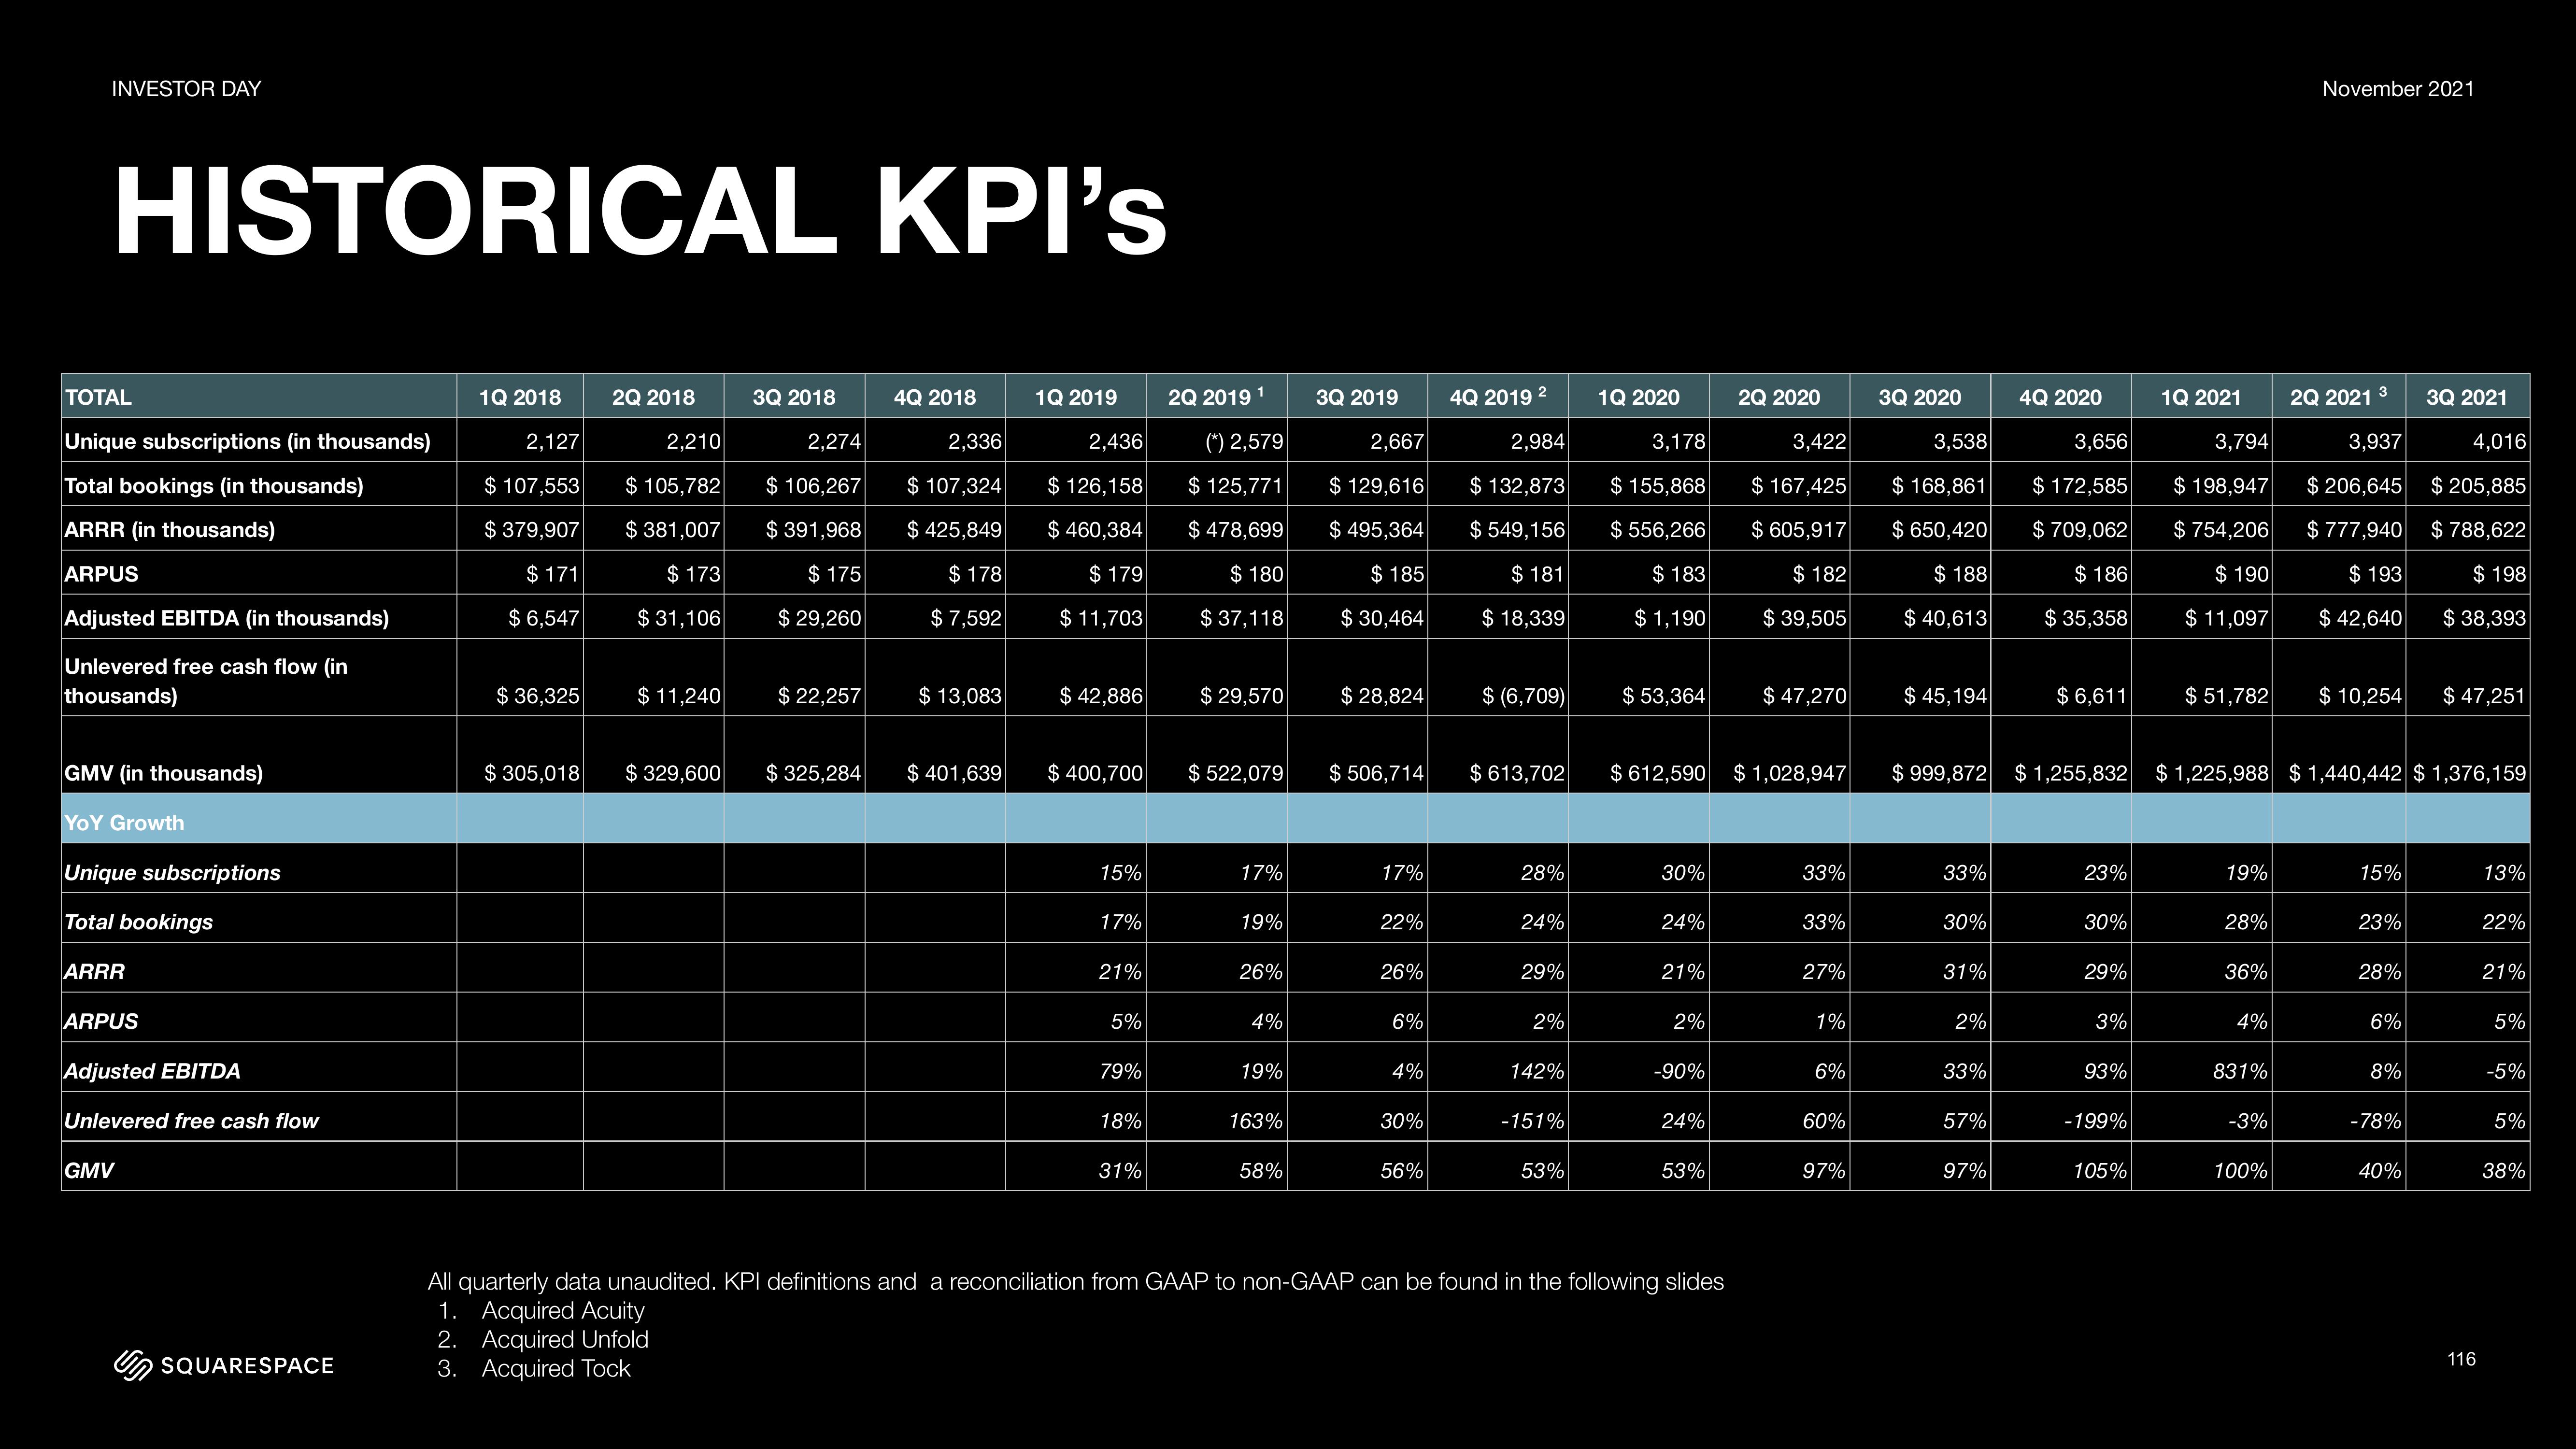
HISTORICAL KPI's
TOTAL
Unique subscriptions (in thousands)
Total bookings (in thousands)
ARRR (in thousands)
ARPUS
Adjusted EBITDA (in thousands)
Unlevered free cash flow (in
thousands)
GMV (in thousands)
YOY Growth
Unique subscriptions
Total bookings
ARRR
ARPUS
Adjusted EBITDA
Unlevered free cash flow
GMV
SQUARESPACE
1Q 2018
2,127
$ 107,553
$379,907
$171
$6,547
$36,325
2Q 2018
2,210
$ 105,782
$ 381,007
$173
$31,106
3Q 2018
2,274
$ 106,267
$ 391,968
$175
$ 29,260
$11,240 $ 22,257
$ 305,018 $329,600 $325,284
4Q 2018
2,336
$ 107,324
$425,849
$ 178
$7,592
$13,083
1Q 2019
2,436
$ 126,158
$460,384
$ 179
$11,703
$ 42,886
$401,639 $400,700
15%
17%
21%
5%
79%
18%
31%
2Q 2019 ¹
(*) 2,579
$ 125,771
$478,699
$ 180
$37,118
$29,570
$ 522,079
17%
19%
26%
4%
19%
163%
58%
3Q 2019
2,667
$129,616
$495,364
$185
$ 30,464
$ 28,824
$ 506,714
17%
22%
26%
6%
4%
30%
56%
4Q 2019 ²
2,984
$ 132,873
$549,156
$181
$ 18,339
$ (6,709)
$613,702
28%
24%
29%
2%
142%
-151%
53%
1Q 2020
3,178
$155,868
$556,266
$183
$1,190
$ 53,364
30%
24%
$612,590 $1,028,947
21%
2%
-90%
24%
53%
2Q 2020
All quarterly data unaudited. KPI definitions and a reconciliation from GAAP to non-GAAP can be found in the following slides
1. Acquired Acuity
2. Acquired Unfold
3. Acquired Tock
3,422
$ 167,425
$605,917
$182
$ 39,505
$ 47,270
33%
33%
27%
1%
6%
60%
97%
3Q 2020
3,538
$ 168,861
$ 650,420
$ 188
$ 40,613
$45,194
33%
30%
31%
2%
33%
57%
4Q 2020
97%
3,656
$172,585
$ 709,062
$ 186
$ 35,358
$6,611
$999,872 $1,255,832 $1,225,988 $ 1,440,442 $1,376,159
23%
30%
29%
3%
93%
-199%
1Q 2021
105%
3,794
$ 198,947
$754,206
$190
$ 11,097
$ 51,782
19%
28%
36%
4%
831%
-3%
November 2021
100%
2Q 2021 3 3Q 2021
3,937
$206,645
$777,940
$ 193
$ 42,640
$ 10,254 $ 47,251
15%
23%
28%
6%
8%
4,016
$ 205,885
$788,622
$198
$38,393
-78%
40%
116
13%
22%
21%
5%
-5%
5%
38%View entire presentation