J.P.Morgan Results Presentation Deck
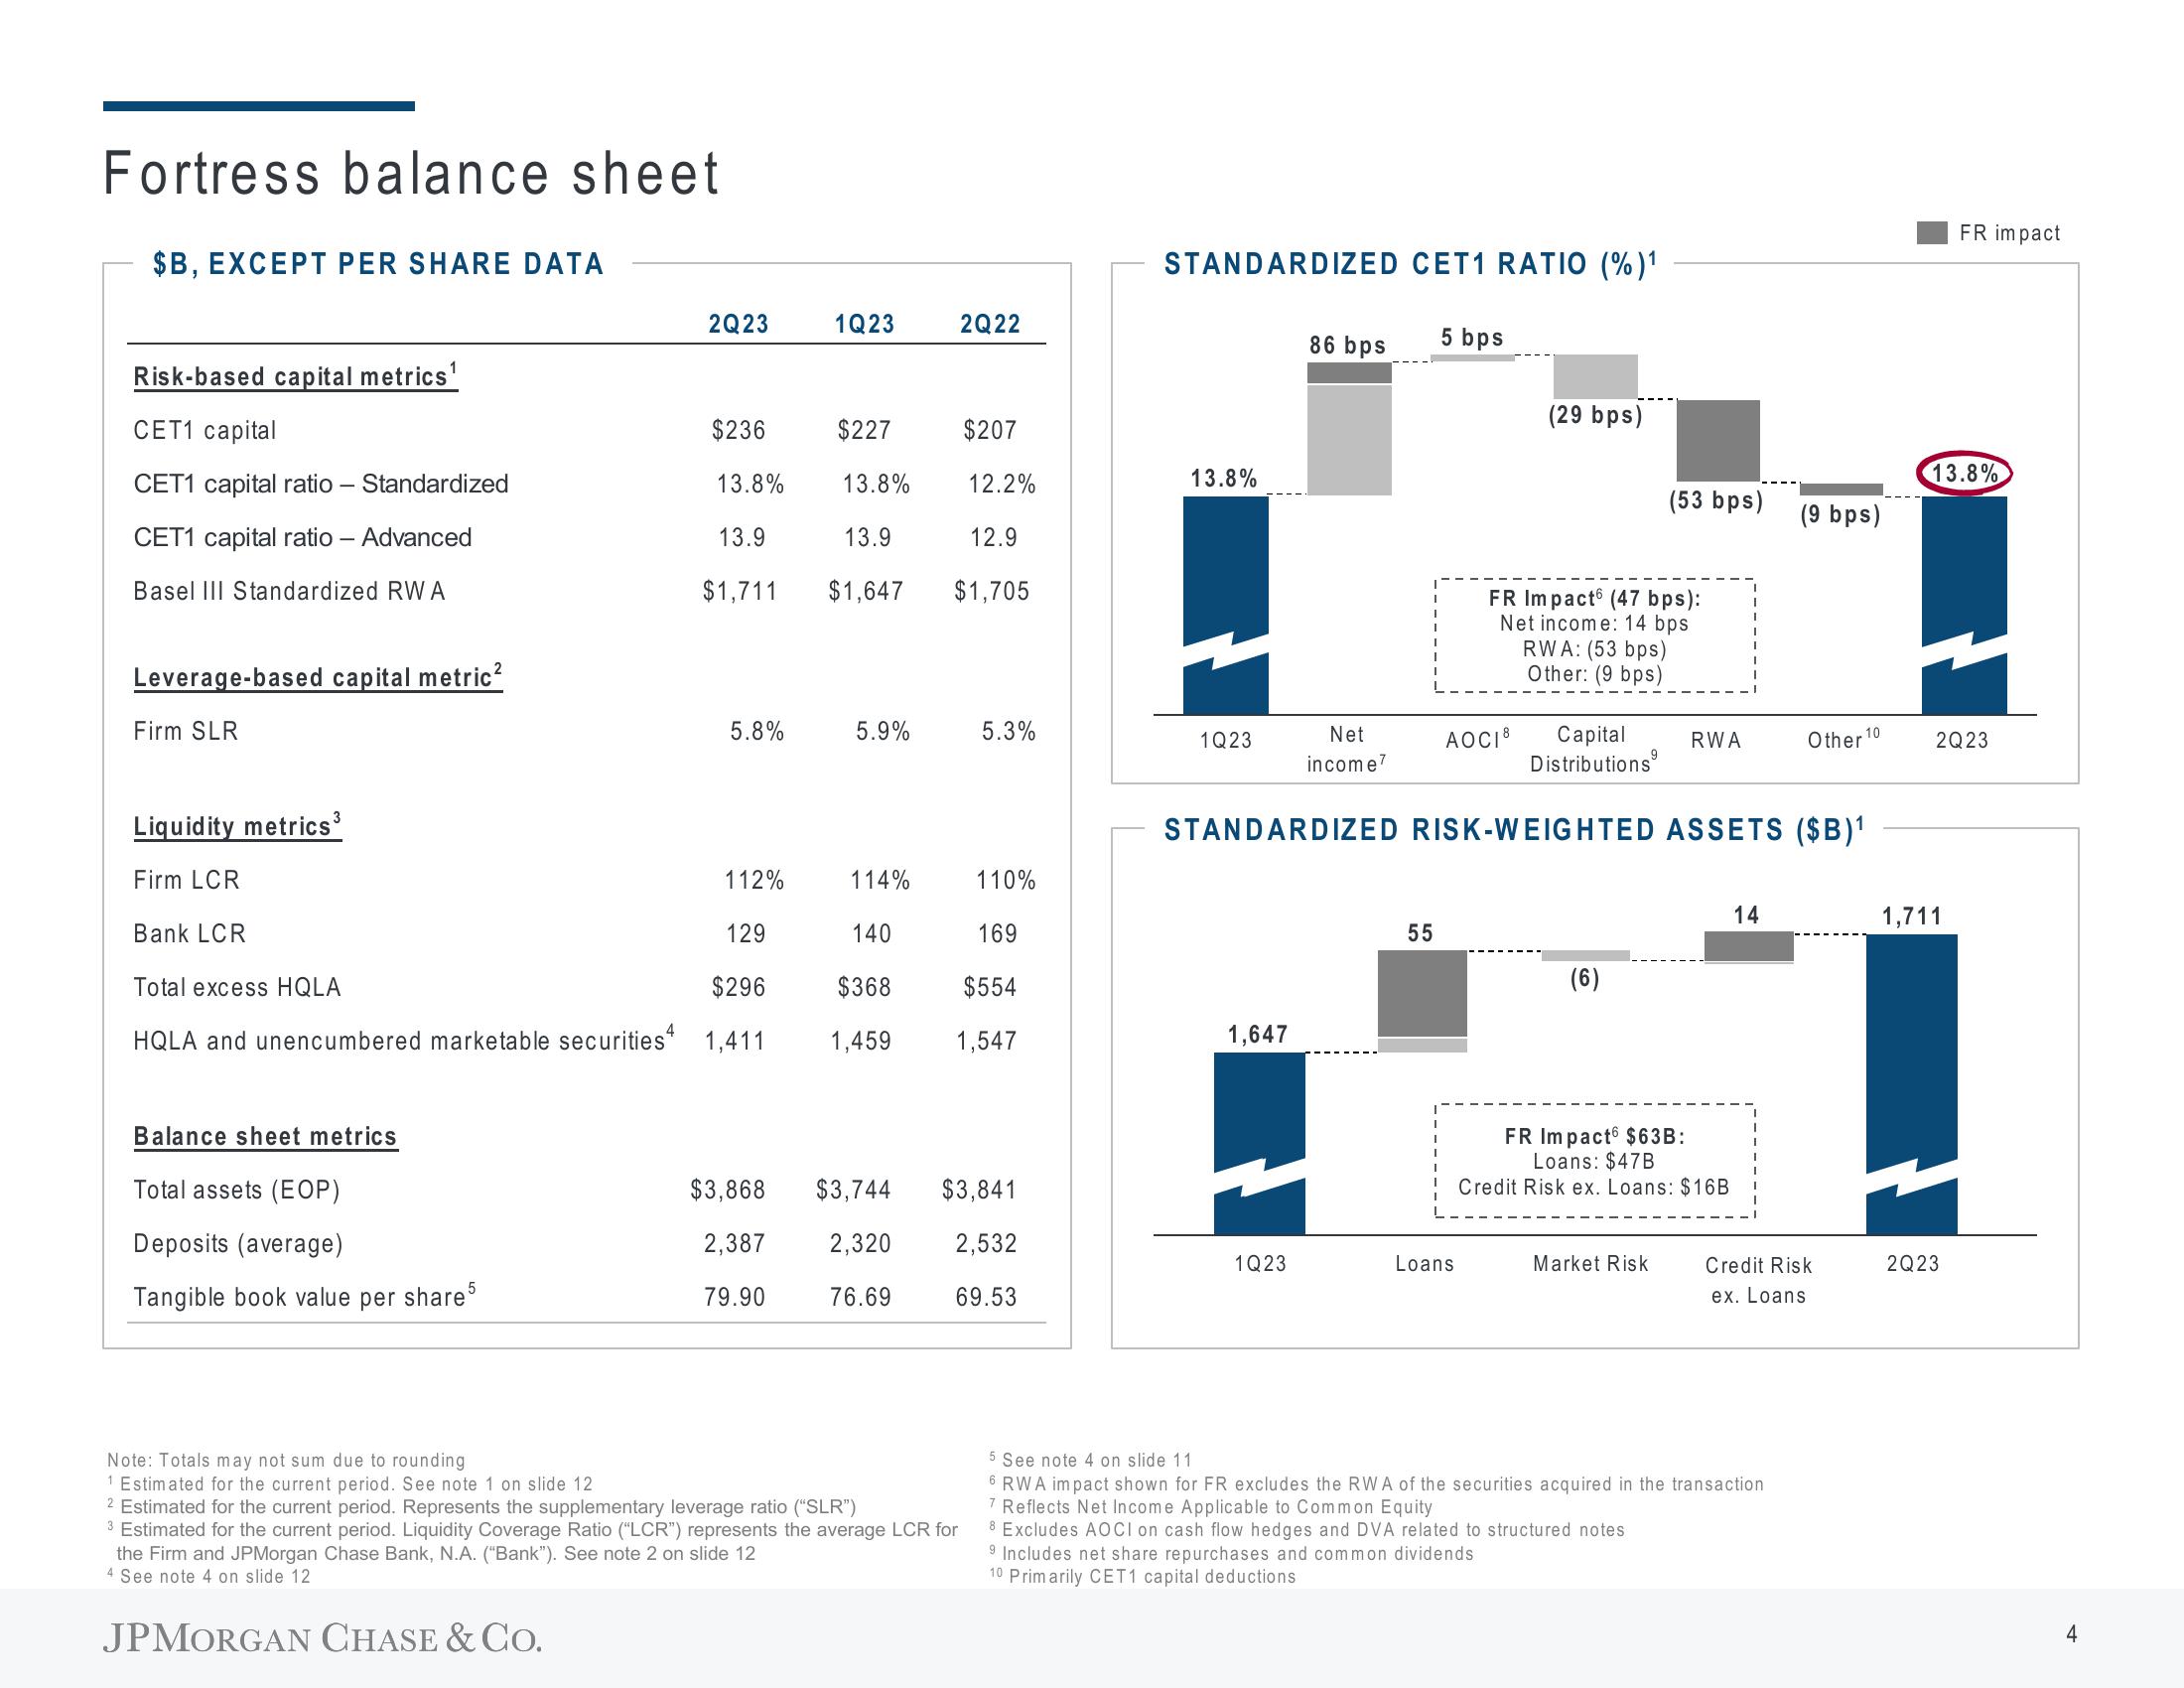
Fortress balance sheet
$B, EXCEPT PER SHARE DATA
Risk-based capital metrics¹
CET1 capital
CET1 capital ratio - Standardized
CET1 capital ratio - - Advanced
Basel III Standardized RWA
Leverage-based capital metric²
Firm SLR
Liquidity metrics³
Firm LCR
Bank LCR
Balance sheet metrics
Total assets (EOP)
Deposits (average)
Tangible book value per share5
2Q23
$236
13.8%
13.9
$1,711
JPMORGAN CHASE & CO.
5.8%
112%
$3,868
2,387
79.90
1Q23
114%
129
140
169
Total excess HQLA
$296
$368
$554
HQLA and unencumbered marketable securities 1,411 1,459 1,547
the Firm and JPMorgan Chase Bank, N.A. ("Bank"). See note 2 on slide 12
4 See note 4 on slide 12
$227
13.8%
13.9
12.9
$1,647 $1,705
5.9%
2Q22
$3,744
2,320
76.69
Note: Totals may not sum due to rounding
1 Estimated for the current period. See note 1 on slide 12
2 Estimated for the current period. Represents the supplementary leverage ratio ("SLR")
3 Estimated for the current period. Liquidity Coverage Ratio ("LCR") represents the average LCR for
$207
12.2%
5.3%
110%
$3,841
2,532
69.53
STANDARDIZED CET1 RATIO (%)¹
13.8%
1Q23
1,647
86 bps
1Q23
Net
income7
5 bps
55
AOCI 8
(29 bps)
Loans
FR Impact (47 bps):
Net income: 14 bps
RWA: (53 bps)
Other: (9 bps)
Capital
Distributions
STANDARDIZED RISK-WEIGHTED ASSETS ($B)¹
(6)
(53 bps)
Market Risk
RWA
FR Impact $63B:
Loans: $47B
Credit Risk ex. Loans: $16B
8 Excludes AOCI on cash flow hedges and DVA related to structured notes
9 Includes net share repurchases and common dividends
10 Primarily CET1 capital deductions
14
(9 bps)
5 See note 4 on slide 11
6 RWA impact shown for FR excludes the RWA of the securities acquired in the transaction
7 Reflects Net Income Applicable to Common Equity
Other 10
Credit Risk
ex. Loans
13.8%
FR impact
2Q23
1,711
2Q23
4View entire presentation