Main Street Capital Investor Presentation Deck
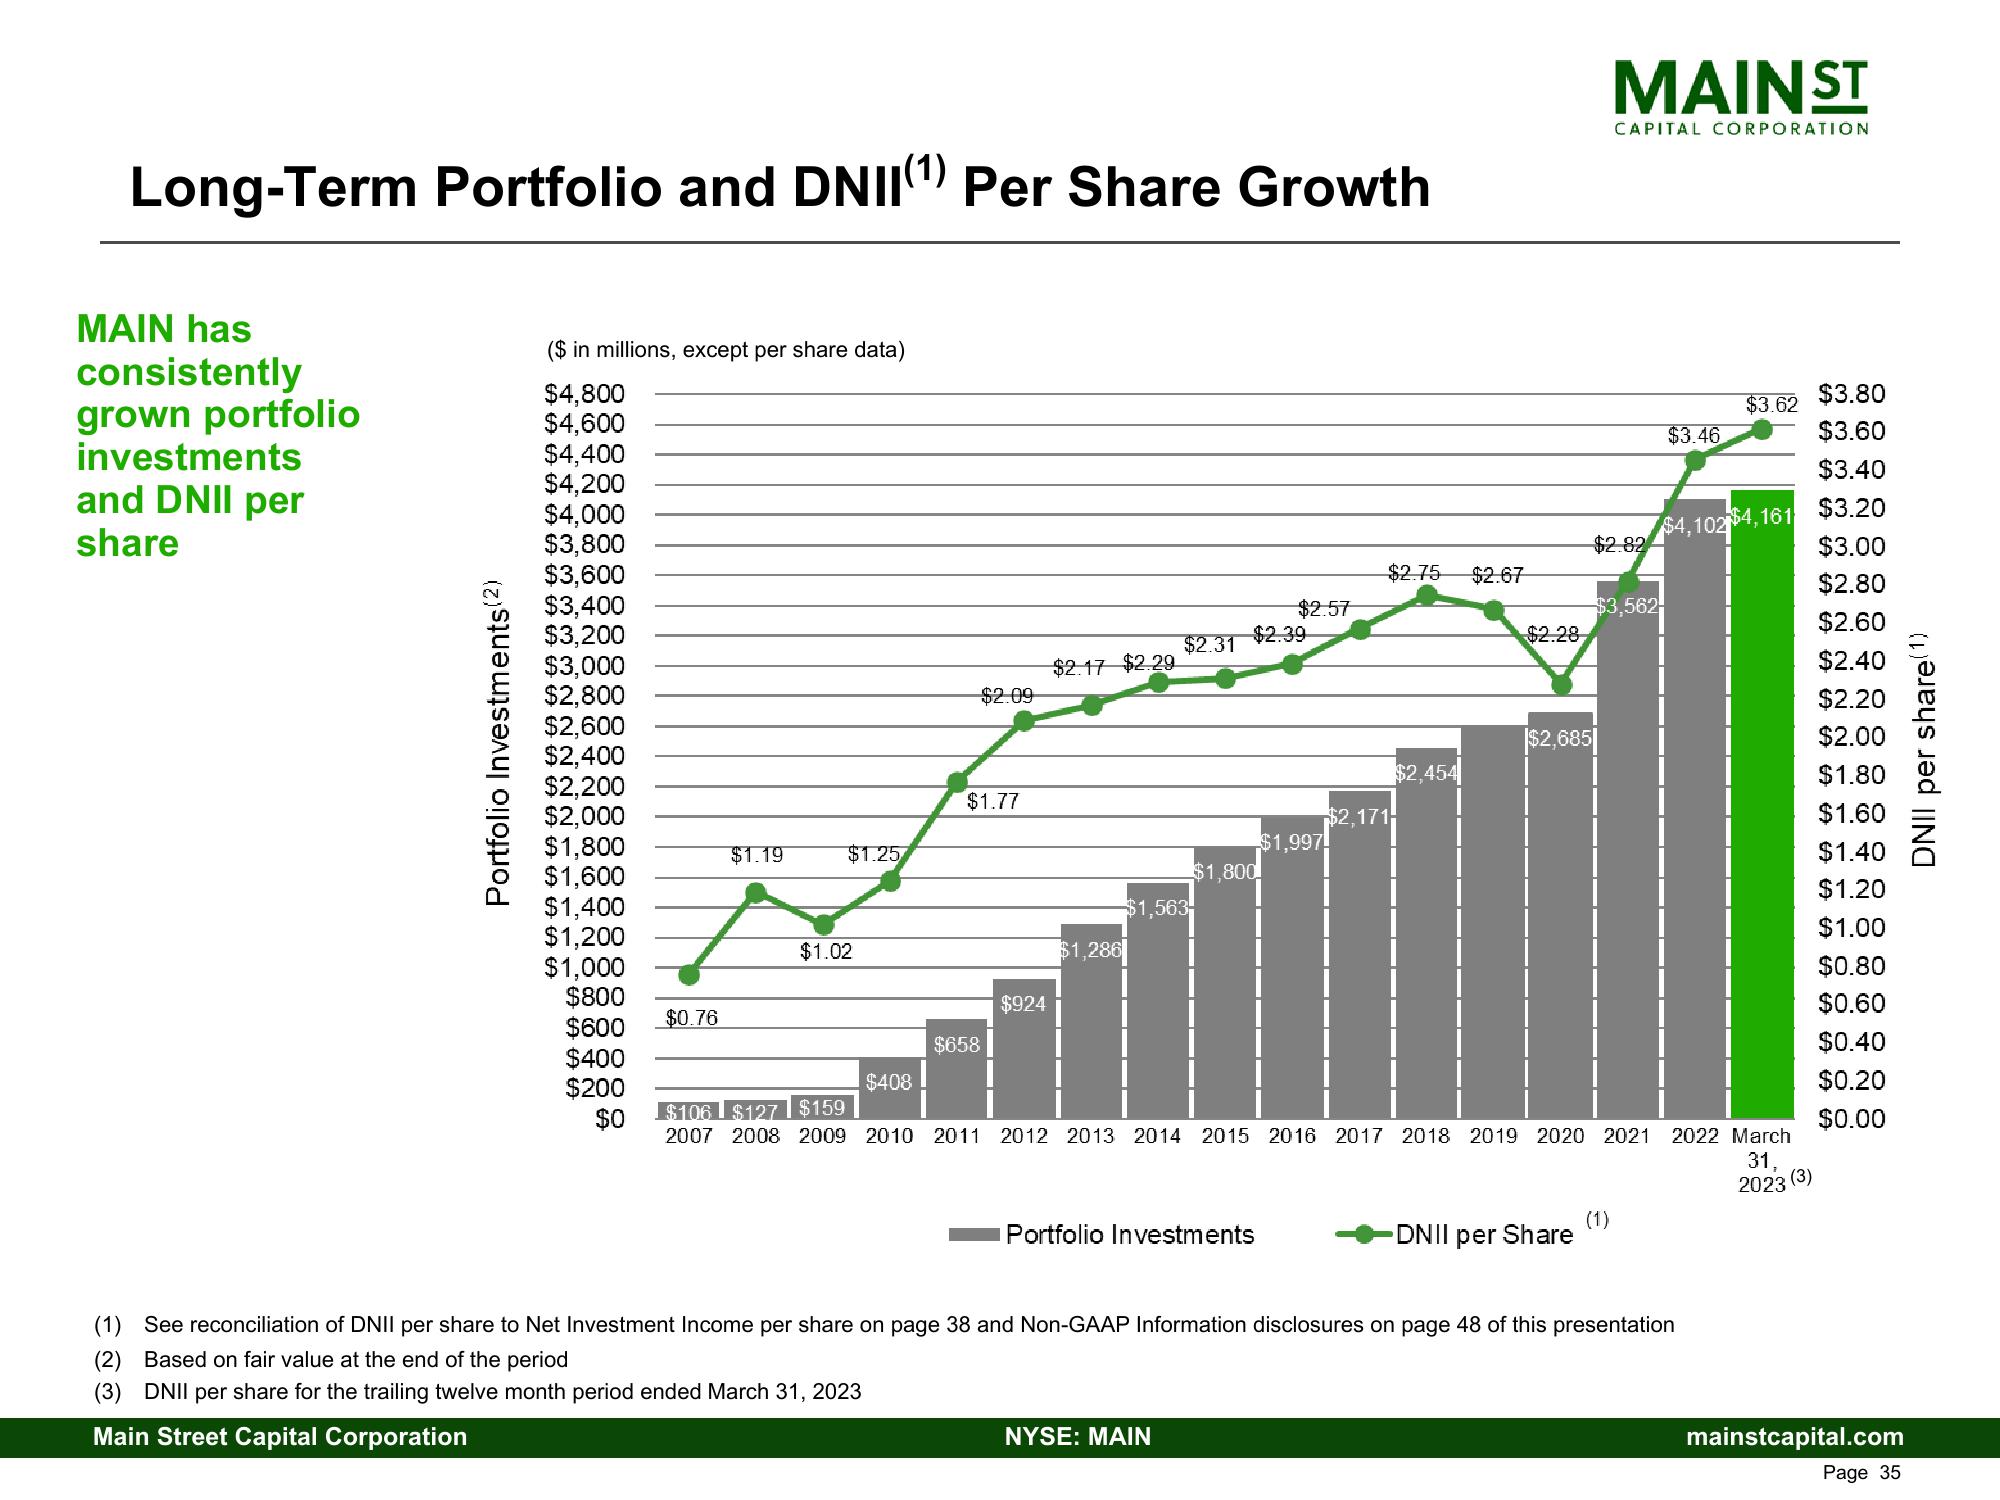
Long-Term Portfolio and DNII(¹) Per Share Growth
MAIN has
consistently
grown portfolio
investments
and DNII per
share
Portfolio Investments(2)
($ in millions, except per share data)
$4,800
$4,600
$4,400
$4,200
$4,000
$3,800
$3,600
$3,400
$3,200
$3,000
$2,800
$2,600
$2,400
$2,200
$2,000
$1,800
$1,600
$1,400
$1,200
$1,000
$800
$600
$400
$200
$0
$0.76
$1.19
$1.25
$1.02
$408
$2.09
$1.77
$658
$924
$2.17 $2.29
$1,286
$2.31
$1,563
$2.39
$1,800
NYSE: MAIN
$2.57
Portfolio Investments
$2.75 $2.67
$2,171
$1,997!
$2,454
$2.28
$2,685
-DNII per Share
MAIN ST
CAPITAL CORPORATION
$2.82
$3,562
(1)
$106 $127 $159
2007 2008 2009 2010 2011 2012 2013 2014 2015 2016 2017 2018 2019 2020 2021 2022 March
$3.46
$3.62
$4,1024,161
(1) See reconciliation of DNII per share to Net Investment Income per share on page 38 and Non-GAAP Information disclosures on page 48 of this presentation
(2) Based on fair value at the end of the period
(3) DNII per share for the trailing twelve month period ended March 31, 2023
Main Street Capital Corporation
31,
2023 (3)
$3.80
$3.60
$3.40
$3.20
$3.00
$2.80
$2.60
$2.40
$2.20
$2.00
$1.80
$1.60
$1.40
$1.20
$1.00
$0.80
$0.60
$0.40
$0.20
$0.00
mainstcapital.com
Page 35
DNII per share(1)View entire presentation