SmileDirectClub Investor Presentation Deck
Marketing & selling.
●
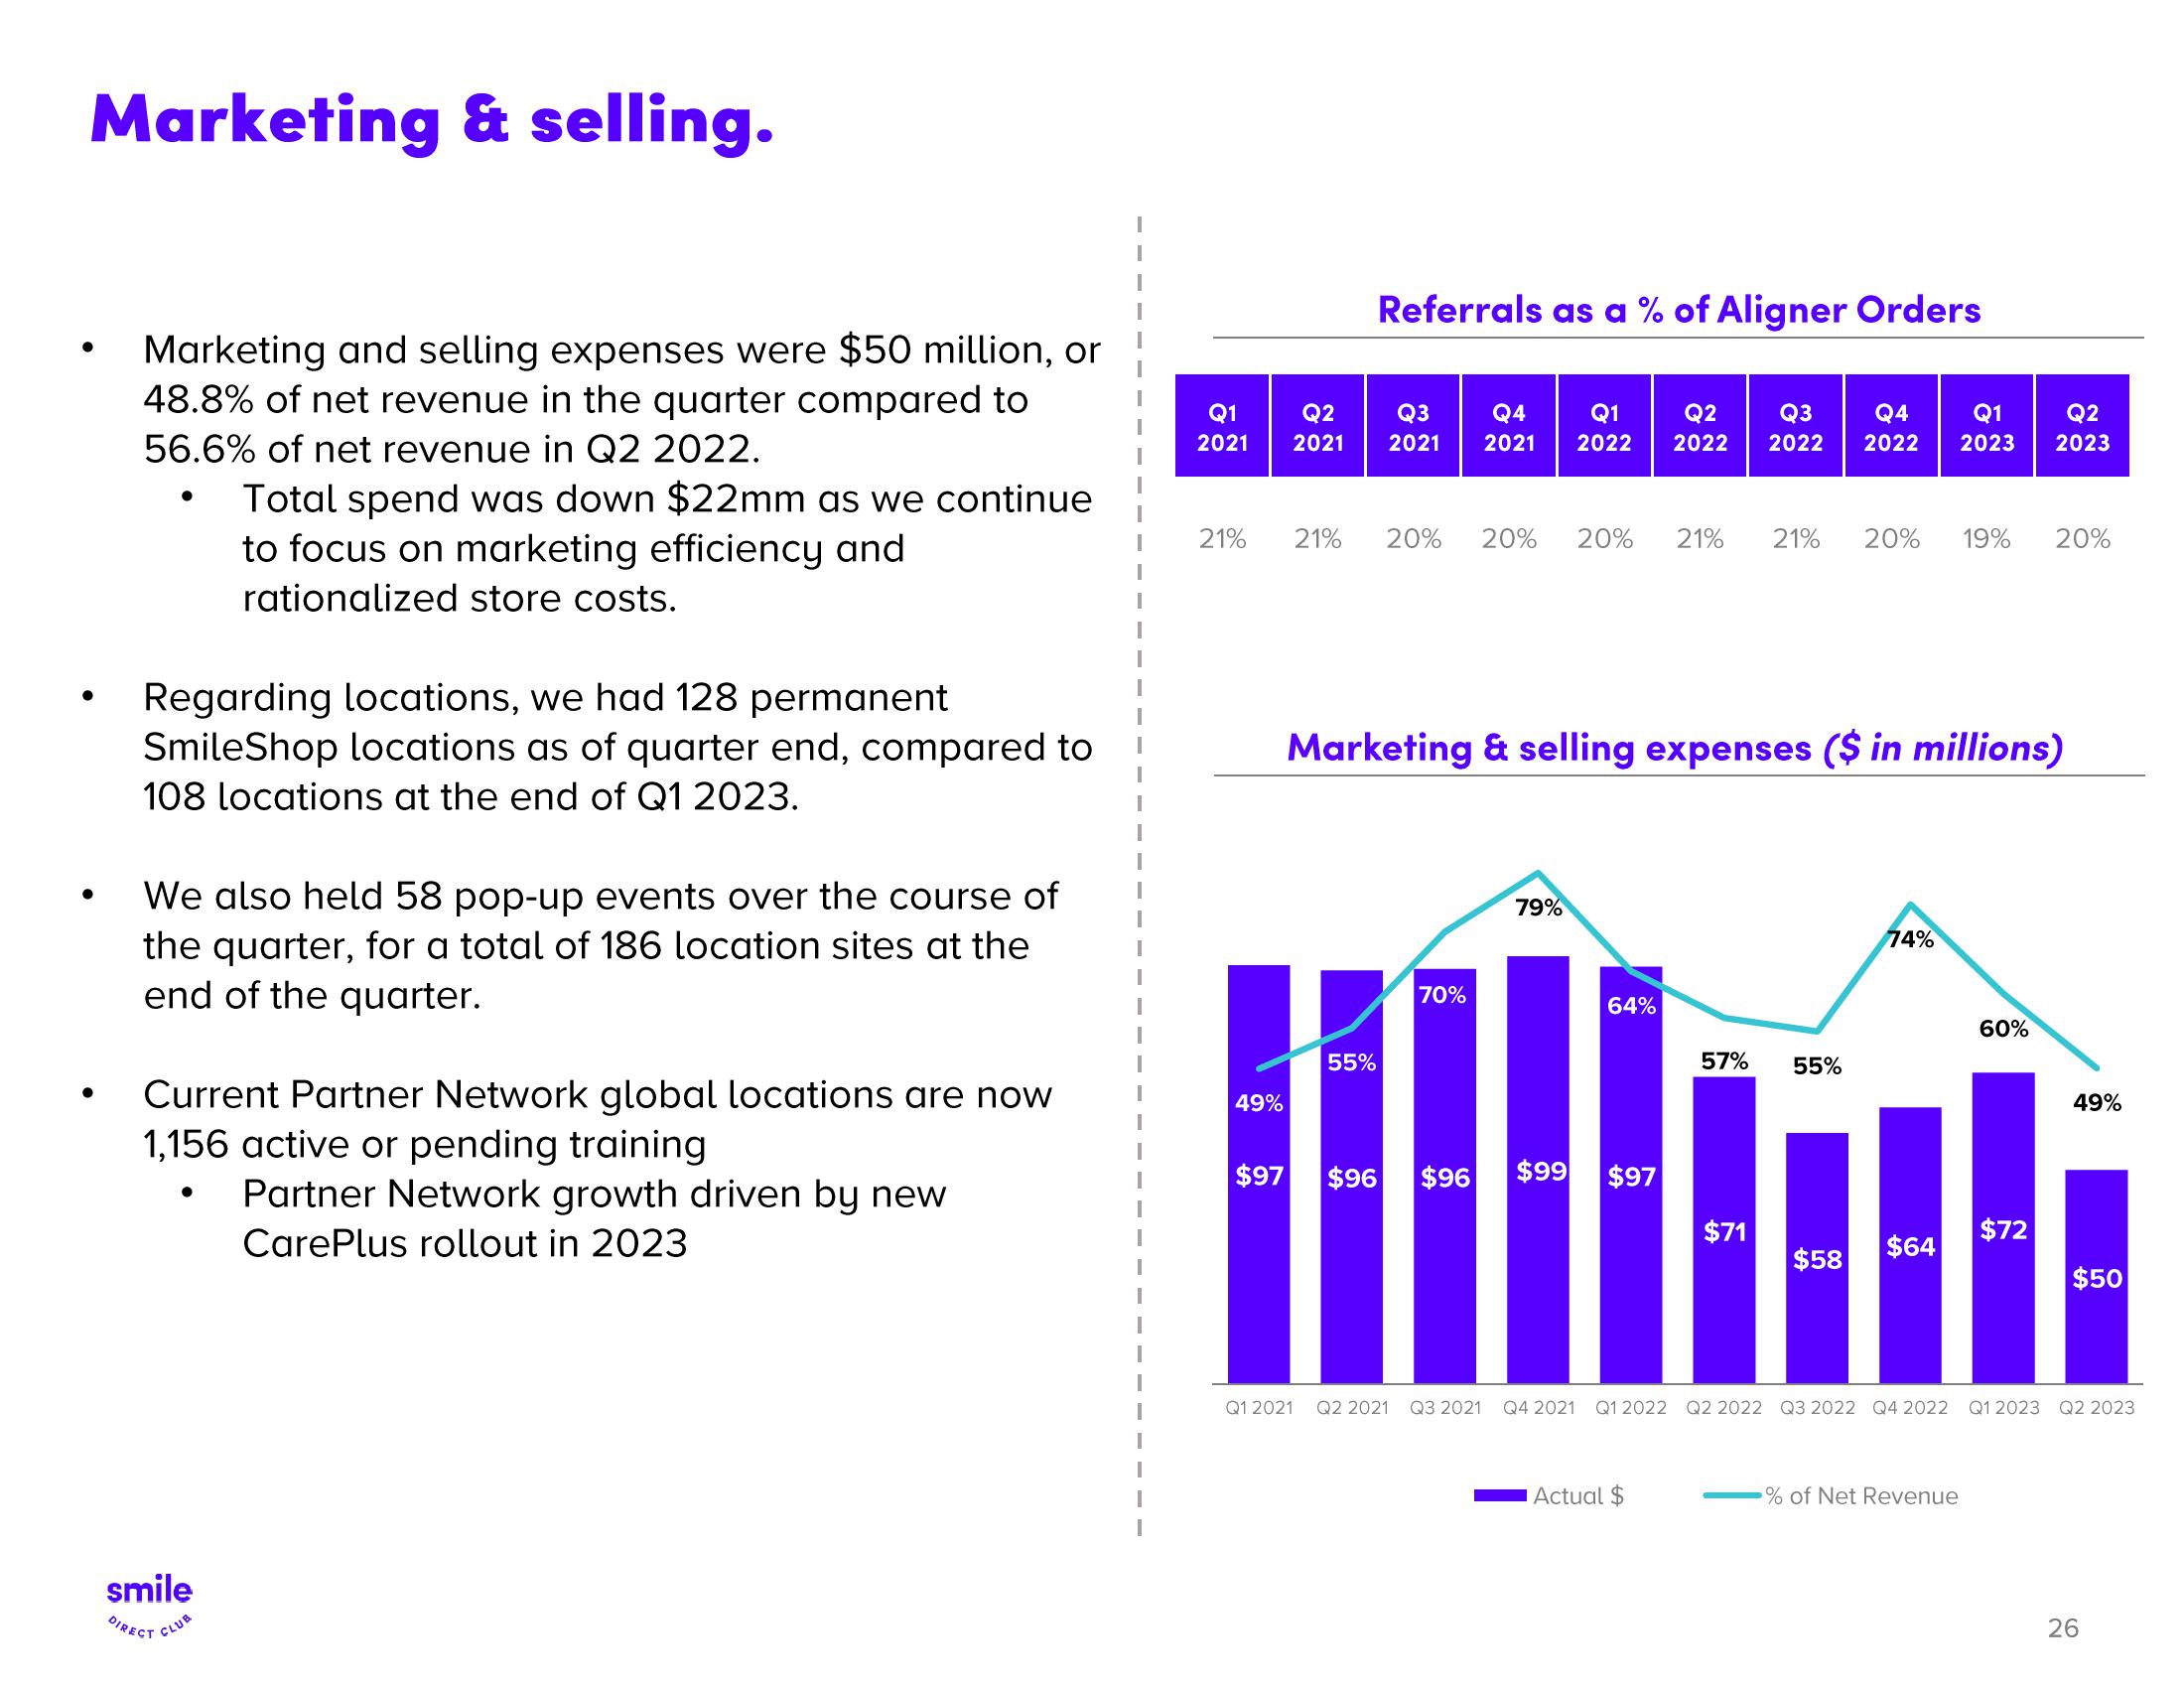
Marketing and selling expenses were $50 million, or
48.8% of net revenue in the quarter compared to
56.6% of net revenue in Q2 2022.
Total spend was down $22mm as we continue
to focus on marketing efficiency and
rationalized store costs.
Regarding locations, we had 128 permanent
SmileShop locations as of quarter end, compared to
108 locations at the end of Q1 2023.
We also held 58 pop-up events over the course of
the quarter, for a total of 186 location sites at the
end of the quarter.
Current Partner Network global locations are now
1,156 active or pending training
Partner Network growth driven by new
CarePlus rollout in 2023
smile
DIRECT CLUB
I
Q1 Q2 Q3 Q4 Q1
2021 2021 2021 2021 2022
21%
49%
$97
21%
Q1 2021
Referrals as a % of Aligner Orders
55%
20% 20% 20%
Marketing & selling expenses ($ in millions)
70%
79%
64%
$96 $96 $99 $97
Q2 Q3
Q4
Q1
2022 2022 2022 2023
Actual $
21% 21% 20% 19% 20%
57% 55%
$71
$58
74%
$64
Q2 2021 Q3 2021 Q4 2021 Q1 2022 Q2 2022 Q3 2022 Q4 2022
% of Net Revenue
Q2
2023
60%
$72
49%
$50
Q1 2023 Q2 2023
26View entire presentation