Azek Investor Presentation Deck
NON-GAAP RECONCILIATIONS
ADJUSTED GROSS PROFIT RECONCILIATION
Fiscal year ending September 30
($ in millions)
Gross Profit
Depreciation
Amortization
Business transformation costs!"
Acquisition costs(²)
Other cost (³)
Adjusted Gross Profit
Adjusted Gross Profit Margin
Notes:
1.
2.
3.
$
$
20 17
FY
169.0
27.2
26.7
1.6
$
224.5 $
35.5%
Twelve M onths Ended September 30,
20 19
20 20
FY
FY
2018
FY
202.0
23.0
26.6
2.4
254.1
37.3%
$
$
253.2
28.9
27.5
5.3
314.9
39.6%
$
$
THE AZEK.
COMPANY
296.1
37.6
24.7
0.7
0.1
359.1
39.9%
$
20 21
LTM Q3
368.0
43.0
22.6
433.6
39.5%
N ine M onths Ended June 30,
$
20 20
YTD Q3
20 5.8
27.9
18.6
0.7
0.1
$
20 21
YTD Q3
253.0 $
39.8%
277.7
33.3
16.5
327.6
39.3%
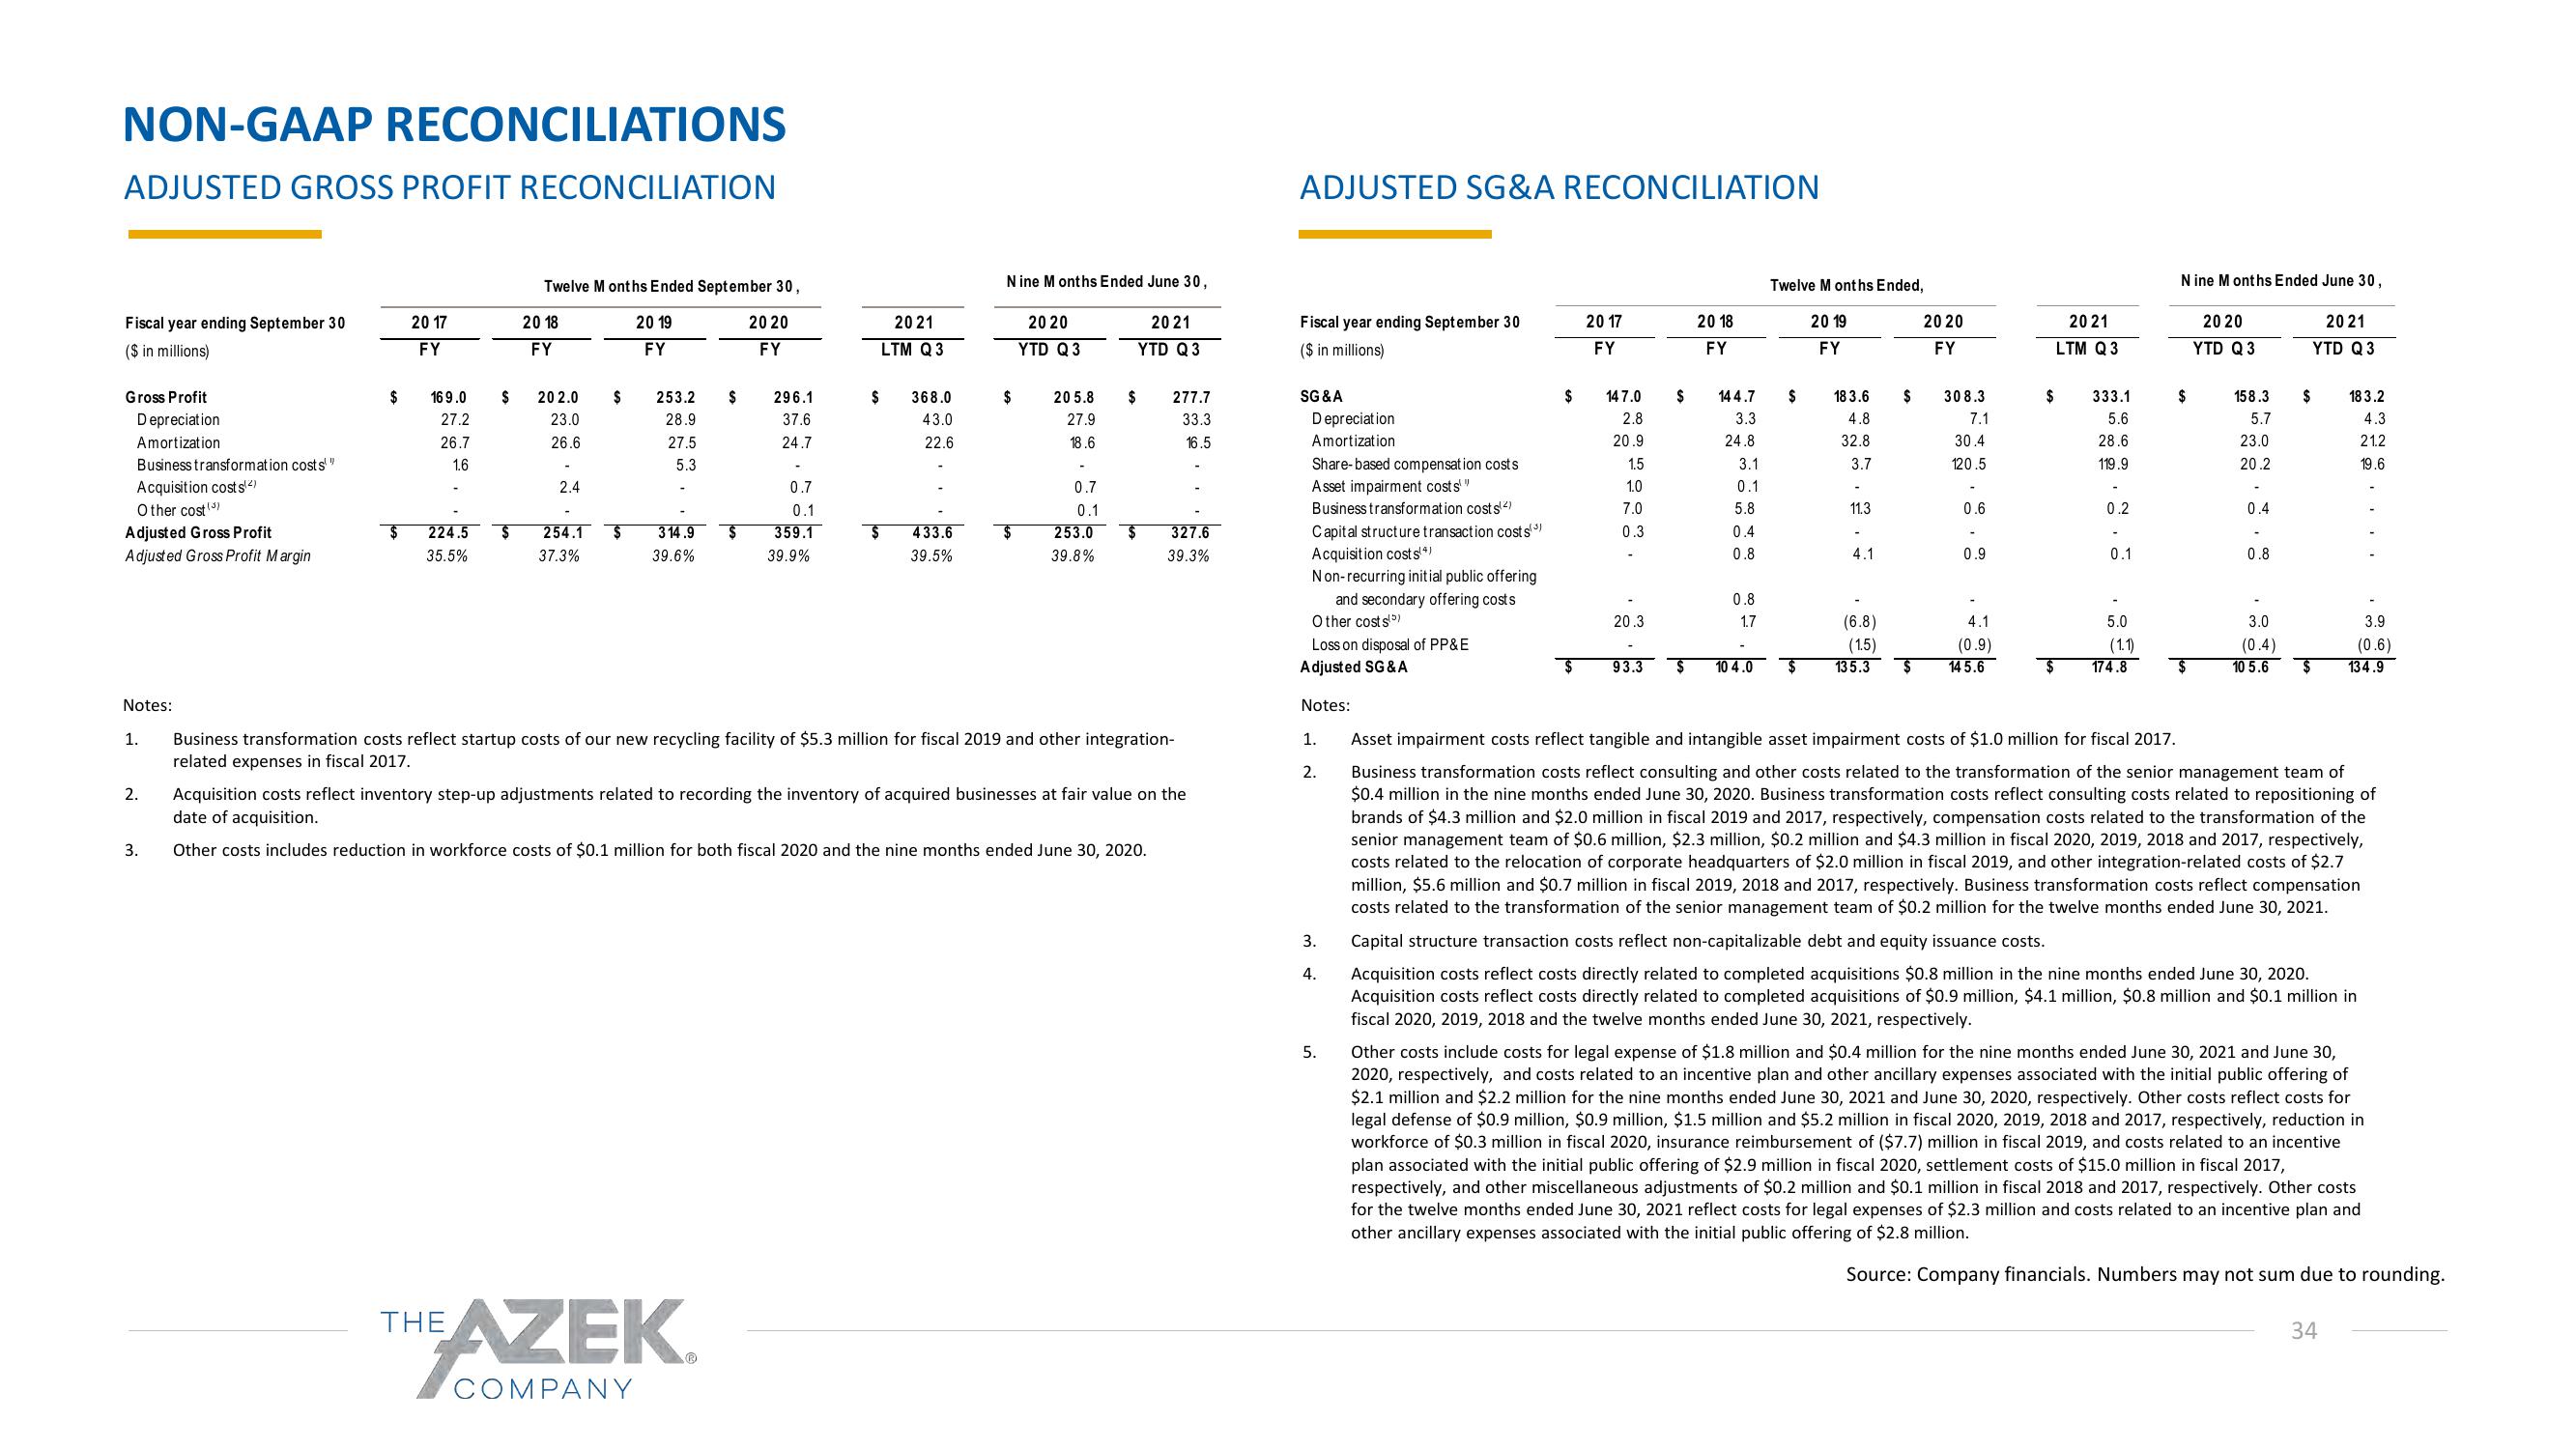
Business transformation costs reflect startup costs of our new recycling facility of $5.3 million for fiscal 2019 and other integration-
related expenses in fiscal 2017.
Acquisition costs reflect inventory step-up adjustments related to recording the inventory of acquired businesses at fair value on the
date of acquisition.
Other costs includes reduction in workforce costs of $0.1 million for both fiscal 2020 and the nine months ended June 30, 2020.
ADJUSTED SG&A RECONCILIATION
Fiscal year ending September 30
($ in millions)
SG&A
Depreciation
Amortization
Share-based compensation costs
Asset impairment costs"
Business transformation costs¹²)
Capital structure transaction costs(³)
Acquisition costs¹4)
Non-recurring initial public offering
and secondary offering costs
Other costs)
Loss on disposal of PP& E
Adjusted SG & A
Notes:
1.
2.
3.
4.
5.
$
2017
FY
147.0
2.8
20.9
1.5
1.0
7.0
0.3
20.3
2018
FY
$ 144.7
3.3
24.8
3.1
0.1
5.8
0.4
0.8
0.8
1.7
$ 93.3 $ 10 4.0
Twelve M onths Ended,
$
$
20 19
FY
183.6
4.8
32.8
3.7
11.3
-
4.1
(6.8)
(1.5)
135.3
$
20 20
FY
308.3
7.1
30.4
120.5
0.6
0.9
4.1
(0.9)
145.6
20 21
LTM Q3
$
333.1
5.6
28.6
119.9
0.2
-
0.1
5.0
(1.1)
174.8
N ine Months Ended June 30,
20 21
YTD Q3
$
$
20 20
YTD Q 3
158.3
5.7
23.0
20.2
-
0.4
-
0.8
3.0
(0.4)
10 5.6
$
18 3.2
4.3
21.2
19.6
3.9
(0.6)
$ 134.9
Asset impairment costs reflect tangible and intangible asset impairment costs of $1.0 million for fiscal 2017.
Business transformation costs reflect consulting and other costs related to the transformation of the senior management team of
$0.4 million in the nine months ended June 30, 2020. Business transformation costs reflect consulting costs related to repositioning of
brands of $4.3 million and $2.0 million in fiscal 2019 and 2017, respectively, compensation costs related to the transformation of the
senior management team of $0.6 million, $2.3 million, $0.2 million and $4.3 million in fiscal 2020, 2019, 2018 and 2017, respectively,
costs related to the relocation of corporate headquarters of $2.0 million in fiscal 2019, and other integration-related costs of $2.7
million, $5.6 million and $0.7 million in fiscal 2019, 2018 and 2017, respectively. Business transformation costs reflect compensation
costs related to the transformation of the senior management team of $0.2 million for the twelve months ended June 30, 2021.
Capital structure transaction costs reflect non-capitalizable debt and equity issuance costs.
Acquisition costs reflect costs directly related to completed acquisitions $0.8 million in the nine months ended June 30, 2020.
Acquisition costs reflect costs directly related to completed acquisitions of $0.9 million, $4.1 million, $0.8 million and $0.1 million in
fiscal 2020, 2019, 2018 and the twelve months ended June 30, 2021, respectively.
Other costs include costs for legal expense of $1.8 million and $0.4 million for the nine months ended June 30, 2021 and June 30,
2020, respectively, and costs related to an incentive plan and other ancillary expenses associated with the initial public offering of
$2.1 million and $2.2 million for the nine months ended June 30, 2021 and June 30, 2020, respectively. Other costs reflect costs for
legal defense of $0.9 million, $0.9 million, $1.5 million and $5.2 million in fiscal 2020, 2019, 2018 and 2017, respectively, reduction in
workforce of $0.3 million in fiscal 2020, insurance reimbursement of ($7.7) million in fiscal 2019, and costs related to an incentive
plan associated with the initial public offering of $2.9 million in fiscal 2020, settlement costs of $15.0 million in fiscal 2017,
respectively, and other miscellaneous adjustments of $0.2 million and $0.1 million in fiscal 2018 and 2017, respectively. Other costs
for the twelve months ended June 30, 2021 reflect costs for legal expenses of $2.3 million and costs related to an incentive plan and
other ancillary expenses associated with the initial public offering of $2.8 million.
Source: Company financials. Numbers may not sum due to rounding.
34View entire presentation