Morgan Stanley Investment Banking Pitch Book
Portions of this exhibit marked [*] are requested to be treated confidentially
.
.
Project Roosevelt
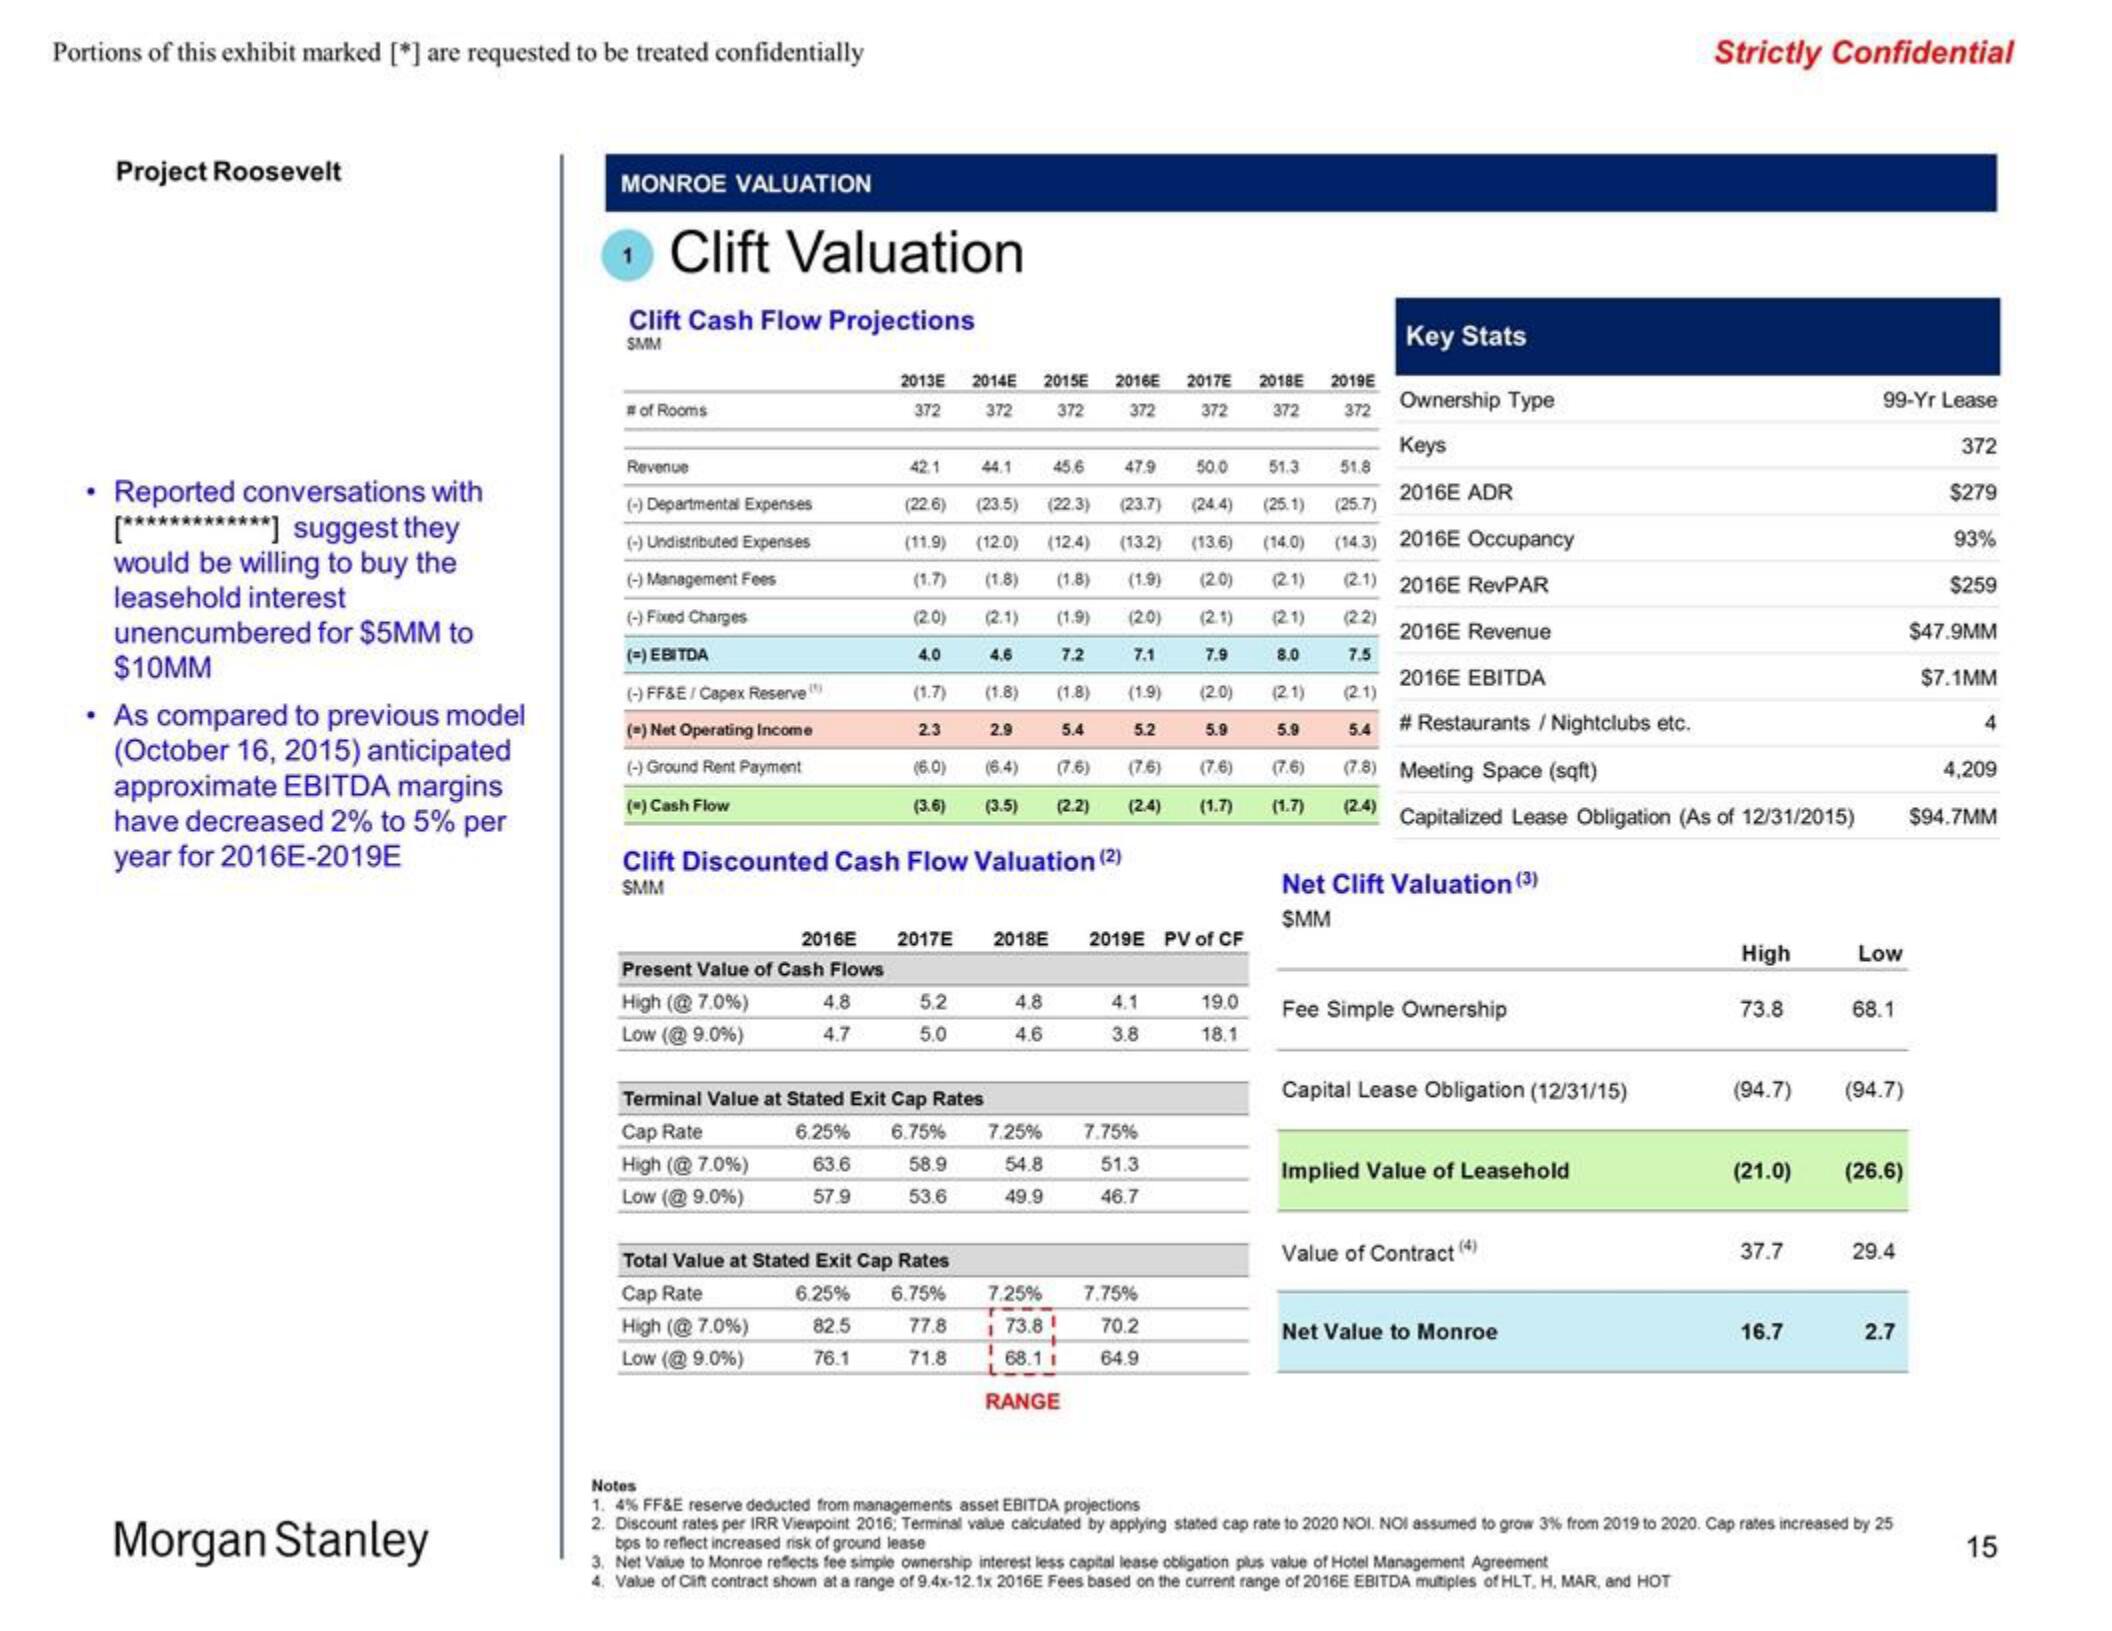
Reported conversations with
[*************] suggest they
would be willing to buy the
leasehold interest
unencumbered for $5MM to
$10MM
As compared to previous model
(October 16, 2015) anticipated
approximate EBITDA margins
have decreased 2% to 5% per
year for 2016E-2019E
Morgan Stanley
MONROE VALUATION
Clift Valuation
Clift Cash Flow Projections
SMM
# of Rooms
Revenue
(-) Departmental Expenses
(-)Undistributed Expenses
(-) Management Fees
(-) Fixed Charges
(=)EBITDA
(-) FF&E/ Capex Reserve
(-) Net Operating Income
(-) Ground Rent Payment
(-) Cash Flow
2016E
Present Value of Cash Flows
High (@ 7.0%)
4.8
Low (@9.0%)
4.7
2013E 2014E 2015E 2016E 2017E 2018E
372
372
372
372
372
372
42.1
Cap Rate
High (@7.0%)
Low (@9.0%)
(22.6) (23.5)
(11.9) (12.0)
(1.7) (1.8)
(2.0) (2.1)
4.0
4.6
(1.7) (1.8)
2.3
44.1
Clift Discounted Cash Flow Valuation (2)
SMM
2017E
5.2
5.0
(6.0) (6.4)
(7.6)
(7.6)
(3.6) (3.5) (2.2) (2.4)
Terminal Value at Stated Exit Cap Rates
2.9
58.9
53.6
Total Value at Stated Exit Cap Rates
Cap Rate
High (@7.0%)
6.25% 6.75%
82.5 77.8
76.1
71.8
Low (@ 9.0%)
(25.1)
45.6 47.9 50.0
(22.3) (23.7) (24.4)
(12.4) (13.2) (13.6)
(1.8) (1.9) (2.0) (2.1)
(1.9) (2.0) (2.1) (2.1)
(14.0)
7.2
(1.8)
7.1
(1.9)
5.4
6.25% 6.75% 7.25%
63.6
54.8
57.9
49.9
4.8
4.6
5.2
7.25%
T
1 73.81
168.11
RANGE
2018E 2019E PV of CF
4.1
3.8
7.75%
51.3
46.7
7.75%
7.9
70.2
64.9
(2.0)
5.9
(7.6)
(1.7)
19.0
18.1
51.3
8.0
(2.1)
5.9
(7.6)
(1.7)
Key Stats
Ownership Type
Keys
2016E ADR
(25.7)
(143) 2016E Occupancy
(2.1) 2016E RevPAR
(22)
2016E Revenue
7.5
2016E EBITDA
# Restaurants / Nightclubs etc.
2019E
372
51.8
(2.1)
5.4
(7.8) Meeting Space (sqft)
(2.4)
Capitalized Lease Obligation (As of 12/31/2015)
Net Clift Valuation (3)
SMM
Fee Simple Ownership
Capital Lease Obligation (12/31/15)
Implied Value of Leasehold
Value of Contract (4)
Strictly Confidential
Net Value to Monroe
High
73.8
(94.7)
(21.0)
37.7
16.7
99-Yr Lease
372
$279
93%
$259
Low
68.1
(94.7)
(26.6)
29.4
2.7
Notes
1. 4% FF&E reserve deducted from managements asset EBITDA projections
2. Discount rates per IRR Viewpoint 2016; Terminal value calculated by applying stated cap rate to 2020 NOI. NOI assumed to grow 3% from 2019 to 2020. Cap rates increased by 25
bps to reflect increased risk of ground lease
3. Net Value to Monroe reflects fee simple ownership interest less capital lease obligation plus value of Hotel Management Agreement
4. Value of Clift contract shown at a range of 9.4x-12.1x 2016E Fees based on the current range of 2016E EBITDA multiples of HLT, H, MAR, and HOT
$47.9MM
$7.1MM
4
4,209
$94.7MM
15View entire presentation