XP Inc Results Presentation Deck
Non-GAAP Financial Information
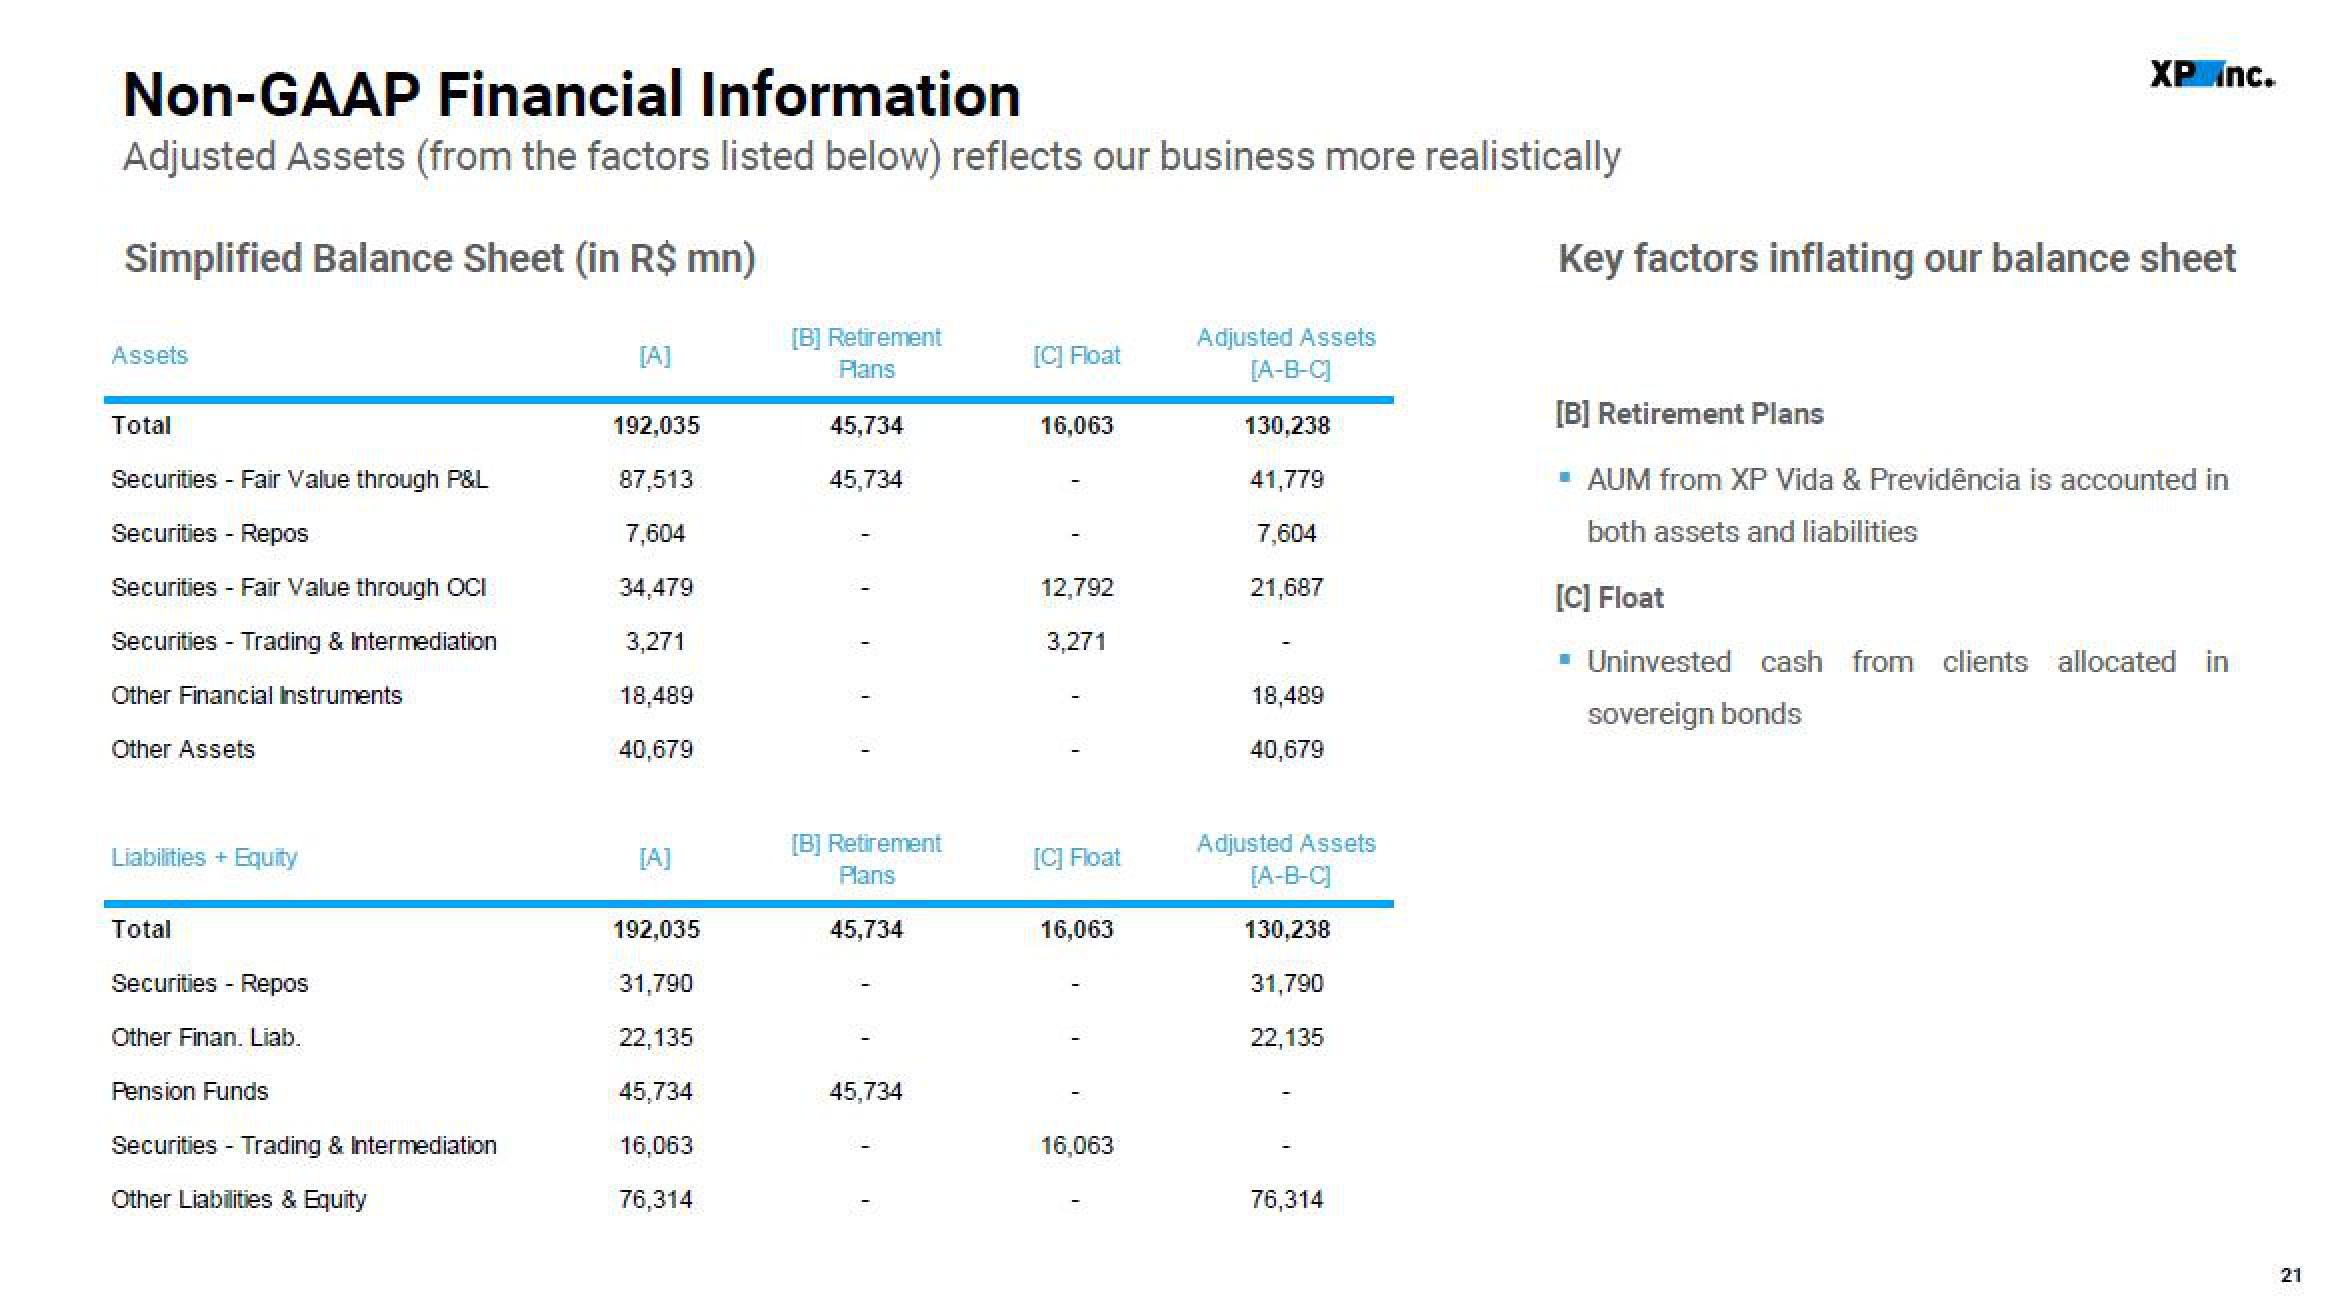
Adjusted Assets (from the factors listed below) reflects our business more realistically
Simplified Balance Sheet (in R$ mn)
Assets
Total
Securities - Fair Value through P&L
Securities - Repos
Securities - Fair Value through OCI
Securities - Trading & Intermediation
Other Financial Instruments
Other Assets
Liabilities + Equity
Total
Securities - Repos
Other Finan. Liab.
Pension Funds
Securities - Trading & Intermediation
Other Liabilities & Equity
[A]
192,035
87,513
7,604
34,479
3,271
18,489
40,679
[A]
192,035
31,790
22,135
45,734
16,063
76,314
[B] Retirement
Plans
45,734
45,734
[B] Retirement
Plans
45,734
45,734
[C] Float
16,063
12,792
3,271
[C] Float
16,063
16,063
Adjusted Assets
[A-B-C]
130,238
41,779
7,604
21,687
18,489
40,679
Adjusted Assets
[A-B-C]
130,238
31,790
22,135
76,314
XP Inc.
Key factors inflating our balance sheet
[B] Retirement Plans
▪ AUM from XP Vida & Previdência is accounted in
both assets and liabilities
[C] Float
▪ Uninvested cash from clients allocated in
sovereign bonds
21View entire presentation