Morgan Stanley Investment Banking Pitch Book
Morgan Stanley
2 Discounted Cash Flow Analysis
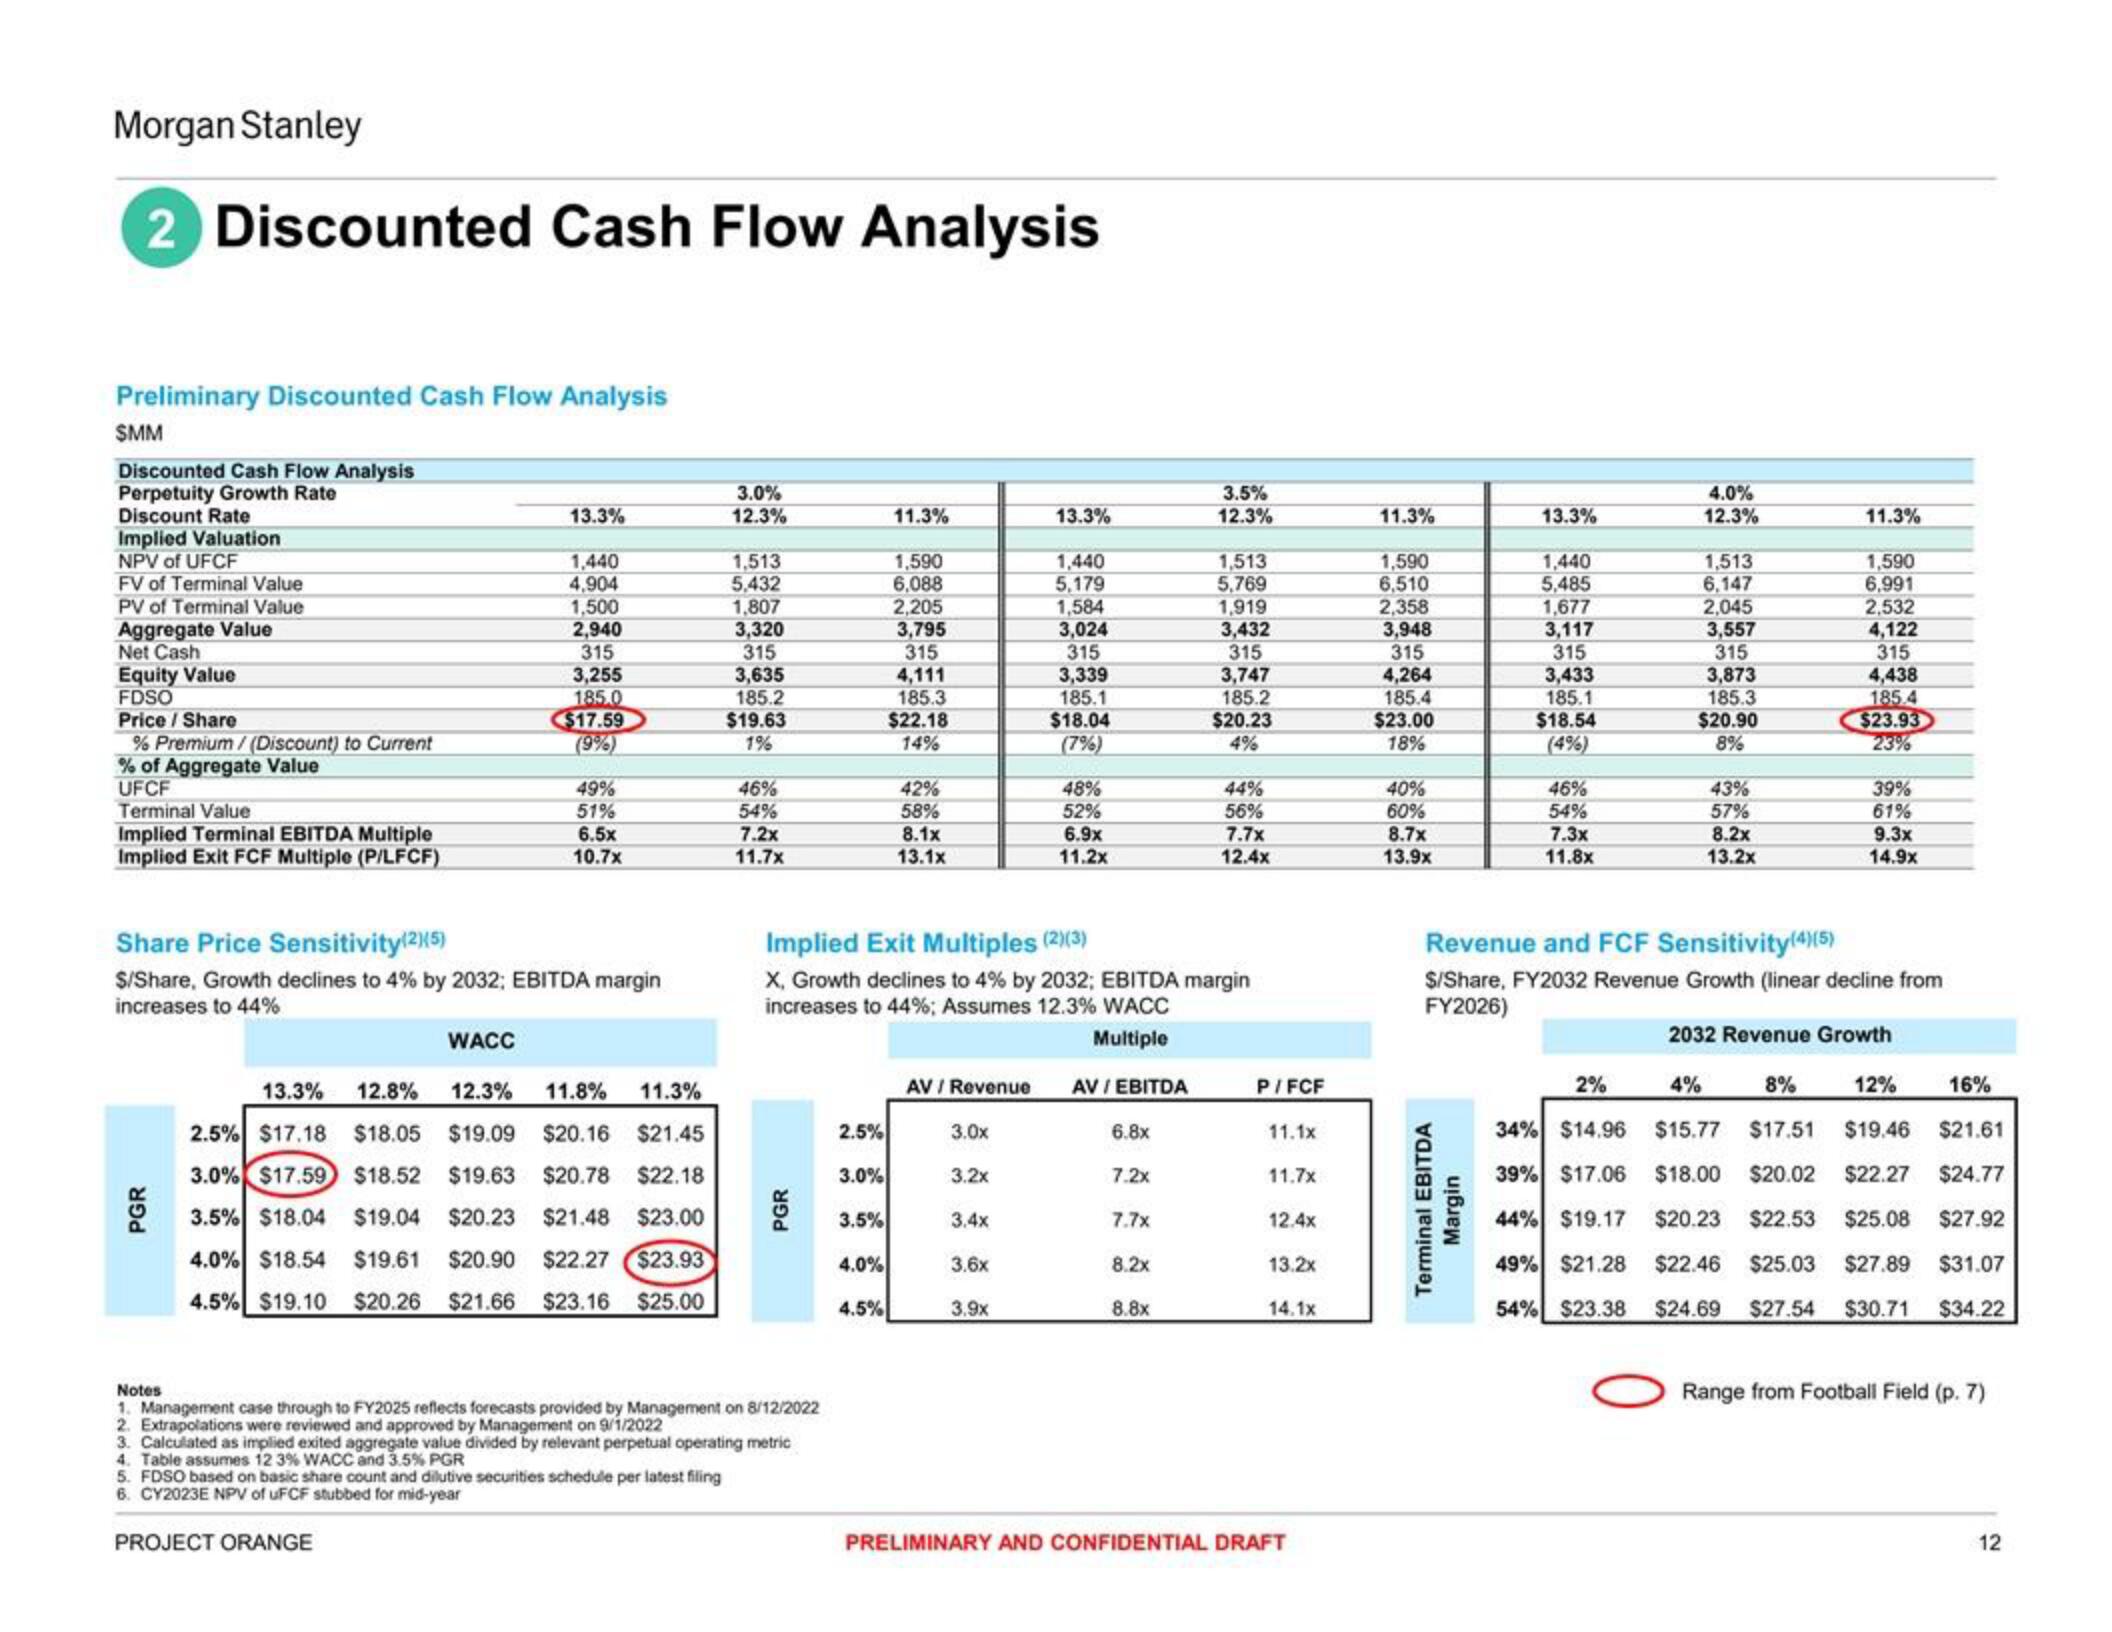
Preliminary Discounted Cash Flow Analysis
SMM
Discounted Cash Flow Analysis
Perpetuity Growth Rate
Discount Rate
Implied Valuation
NPV of UFCF
FV of Terminal Value
PV of Terminal Value
Aggregate Value
Net Cash
Equity Value
FDSO
Price/Share
% Premium/ (Discount) to Current
% of Aggregate Value
UFCF
Terminal Value
Implied Terminal EBITDA Multiple
Implied Exit FCF Multiple (P/LFCF)
PGR
13.3%
1,440
4,904
1.500
2,940
315
3,255
185.0
$17.59
(9%)
Share Price Sensitivity(2)(5)
$/Share, Growth declines to 4% by 2032; EBITDA margin
increases to 44%
49%
51%
6.5x
10.7x
PROJECT ORANGE
WACC
13.3% 12.8%
12.3% 11.8% 11.3%
2.5% $17.18 $18.05 $19.09 $20.16 $21.45
3.0% $17.59 $18.52 $19.63 $20.78 $22.18
3.5% $18.04 $19.04 $20.23 $21.48 $23.00
4.0% $18.54 $19.61 $20.90 $22.27 $23.93
4.5% $19.10 $20.26 $21.66 $23.16 $25.00
5. FDSO based on basic share count and dilutive securities schedule per latest filing
6. CY2023E NPV of uFCF stubbed for mid-year
3.0%
12.3%
1,513
5,432
1.807
3,320
315
3,635
185.2
$19.63
1%
46%
54%
7.2x
11.7x
Notes
1. Management case through to FY2025 reflects forecasts provided by Management on 8/12/2022
2. Extrapolations were reviewed and approved by Management on 9/1/2022
3. Calculated as implied exited aggregate value divided by relevant perpetual operating metric
4. Table assumes 12 3% WACC and 3.5% PGR
PGR
2.5%
3.0%
3.5%
11.3%
4.0%
4.5%
1,590
6,088
2,205
3,795
315
4,111
185.3
$22.18
14%
42%
58%
8.1x
13.1x
AV / Revenue
Implied Exit Multiples (2)(3)
X, Growth declines to 4% by 2032; EBITDA margin
increases to 44%; Assumes 12.3% WACC
Multiple
3.0x
3.2x
13.3%
3.4x
3.6x
3.9x
1,440
5,179
1,584
3,024
315
3,339
185.1
$18.04
(7%)
48%
52%
6.9x
11.2x
AV / EBITDA
6.8x
3.5%
12.3%
7.2x
7.7x
8.2x
8.8x
1,513
5,769
1,919
3,432
315
3,747
185.2
$20.23
4%
44%
56%
7.7x
12.4x
P/FCF
11.1x
11.7x
12.4x
13.2x
14.1x
PRELIMINARY AND CONFIDENTIAL DRAFT
11.3%
1,590
6,510
2,358
3,948
315
4,264
185.4
$23.00
18%
40%
60%
8.7x
13.9x
13.3%
Terminal EBITDA
Margin
1,440
5,485
1,677
3,117
315
3,433
185.1
$18.54
46%
54%
7.3x
11.8x
4.0%
12.3%
2%
1,513
6,147
2,045
3,557
315
3,873
185.3
$20.90
8%
43%
57%
8.2x
13.2x
11.3%
1,590
6,991
2,532
4,122
315
4,438
185.4
$23.93
23%
Revenue and FCF Sensitivity(4)(5)
$/Share, FY2032 Revenue Growth (linear decline from
FY2026)
2032 Revenue Growth
39%
61%
9.3x
14.9x
4%
8%
12%
16%
34% $14.96 $15.77 $17.51 $19.46 $21.61
39% $17.06 $18.00 $20.02 $22.27 $24.77
44% $19.17 $20.23 $22.53 $25.08 $27.92
49% $21.28 $22.46 $25.03 $27.89 $31.07
$24.69 $27.54 $30.71 $34.22
54% $23.38
Range from Football Field (p. 7)
12View entire presentation