Q2 Quarter 2023
Income Summary
Income Summary
$ in millions, except per share data
Q2 23
Q1 23
Q2 22
Q1 23
% Change vs
Q2 22
Net interest income
$163.2
$177.8
$185.1
(8) %
(12) %
Noninterest income, excluding securities gain (loss) 1
45.4
45.8
40.3
(1)
13
Total revenue, excluding securities gain (loss) ¹
1
208.6
223.7
225.4
(7)
(7)
Noninterest expense
139.7
143.2
156.8
(2)
(11)
Pre-provision net revenue¹
68.9
80.4
68.6
(14)
Gain (loss) on sale of securities
(0.4)
(0.2)
NM
NM
Provision for credit losses on loans
0.1
10.9
33.9
NM
NM
Provision for credit losses on investment securities
13.3
NM
Provision for income taxes
10.1
10.6
7.2
(5)
42
Net income
$ 58.3
$ 45.6
$ 27.5
28 %
112 %
Diluted EPS
$ 0.46
$ 0.36
$ 0.21
28 %
119 %
Impact of certain items, net of tax ¹, 2
$ 2.8
$ 1.8
$ 40.6
Adjusted pre-provision net revenue¹
$ 72.6
$ 82.8
$ 89.9
(12) %
(19) %
Adjusted earnings¹
$ 61.1
$ 47.3
$ 68.1
29%
(10) %
Adjusted diluted EPS¹
$ 0.48
$ 0.37
$ 0.53
30%
(9) %
$5
Note: Numbers may not add due to rounding NM - not meaningful
(1) Non-GAAP measures that management believes aids in the discussion of results. See appendix for Non-GAAP reconciliation
(2) Effective tax rate of 26.135%
Q2 23 Highlights
Linked Quarter Comparison (Q2 23 vs Q1 23)
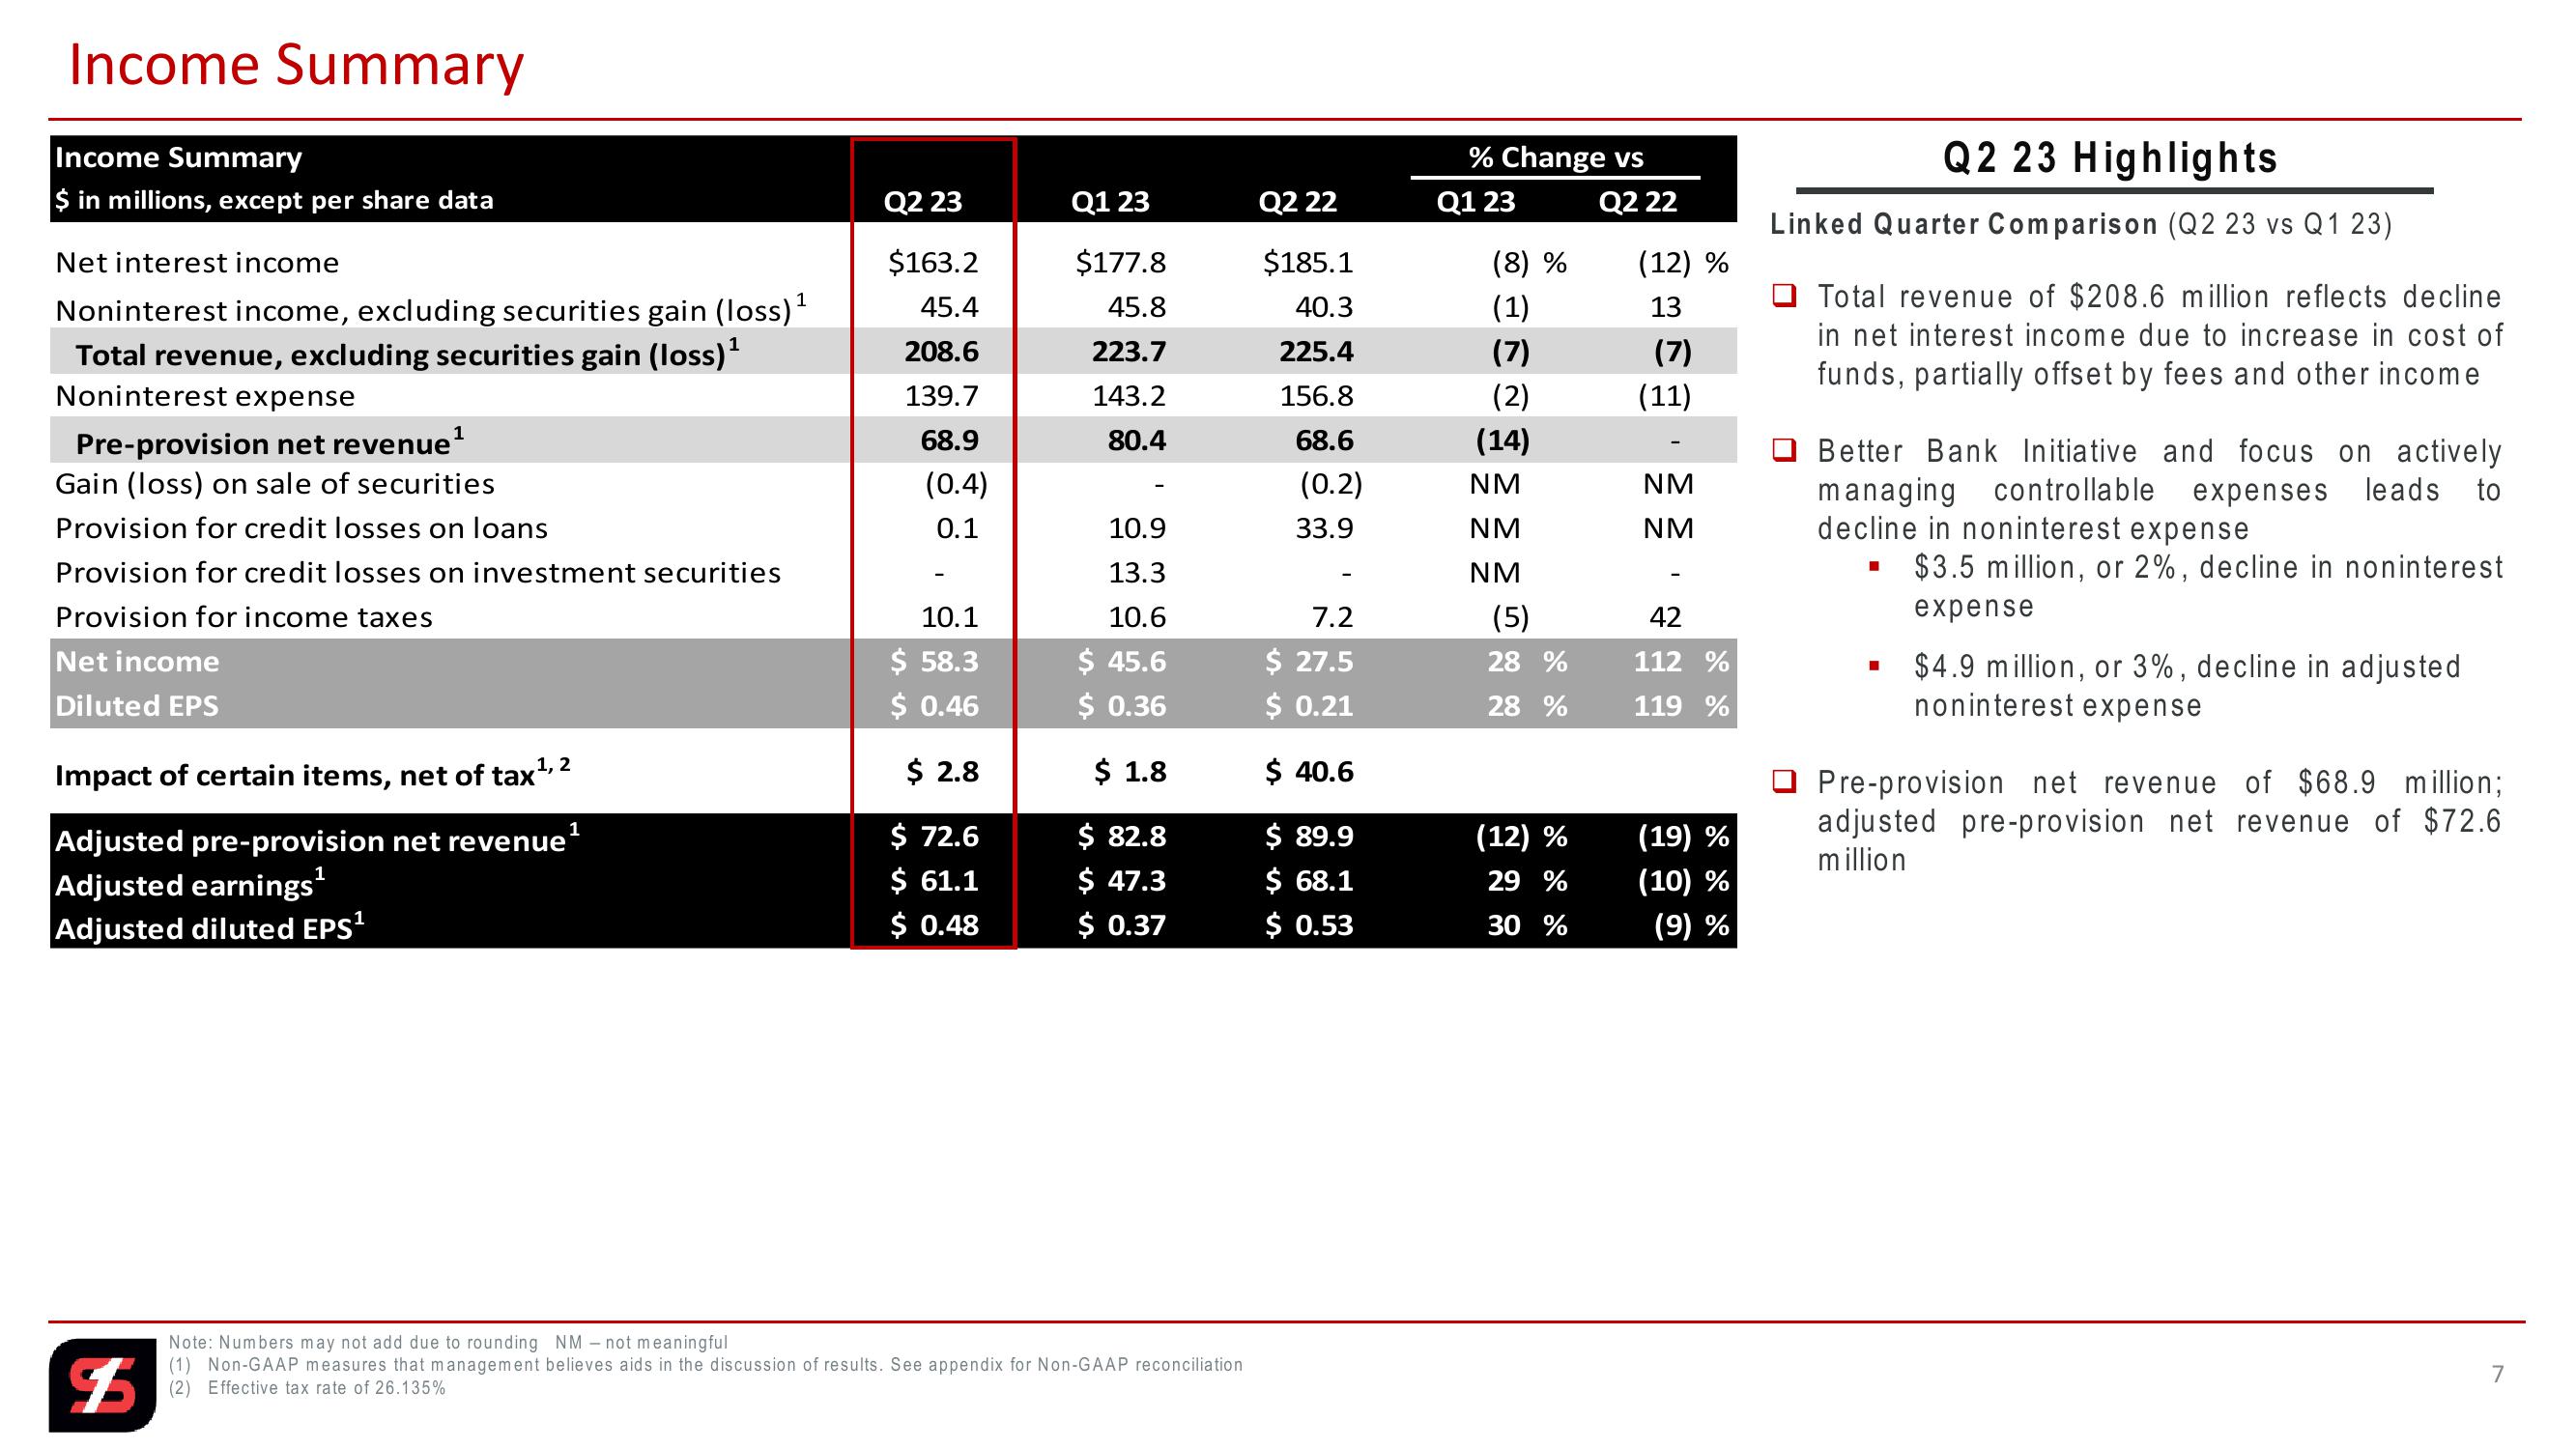
Total revenue of $208.6 million reflects decline
in net interest income due to increase in cost of
funds, partially offset by fees and other income
Better Bank Initiative and focus on actively
managing controllable expenses leads to
decline in noninterest expense
$3.5 million, or 2%, decline in noninterest
expense
$4.9 million, or 3%, decline in adjusted
noninterest expense
Pre-provision net revenue of $68.9 million;
adjusted pre-provision net revenue of $72.6
million
7View entire presentation