Bank of America Investment Banking Pitch Book
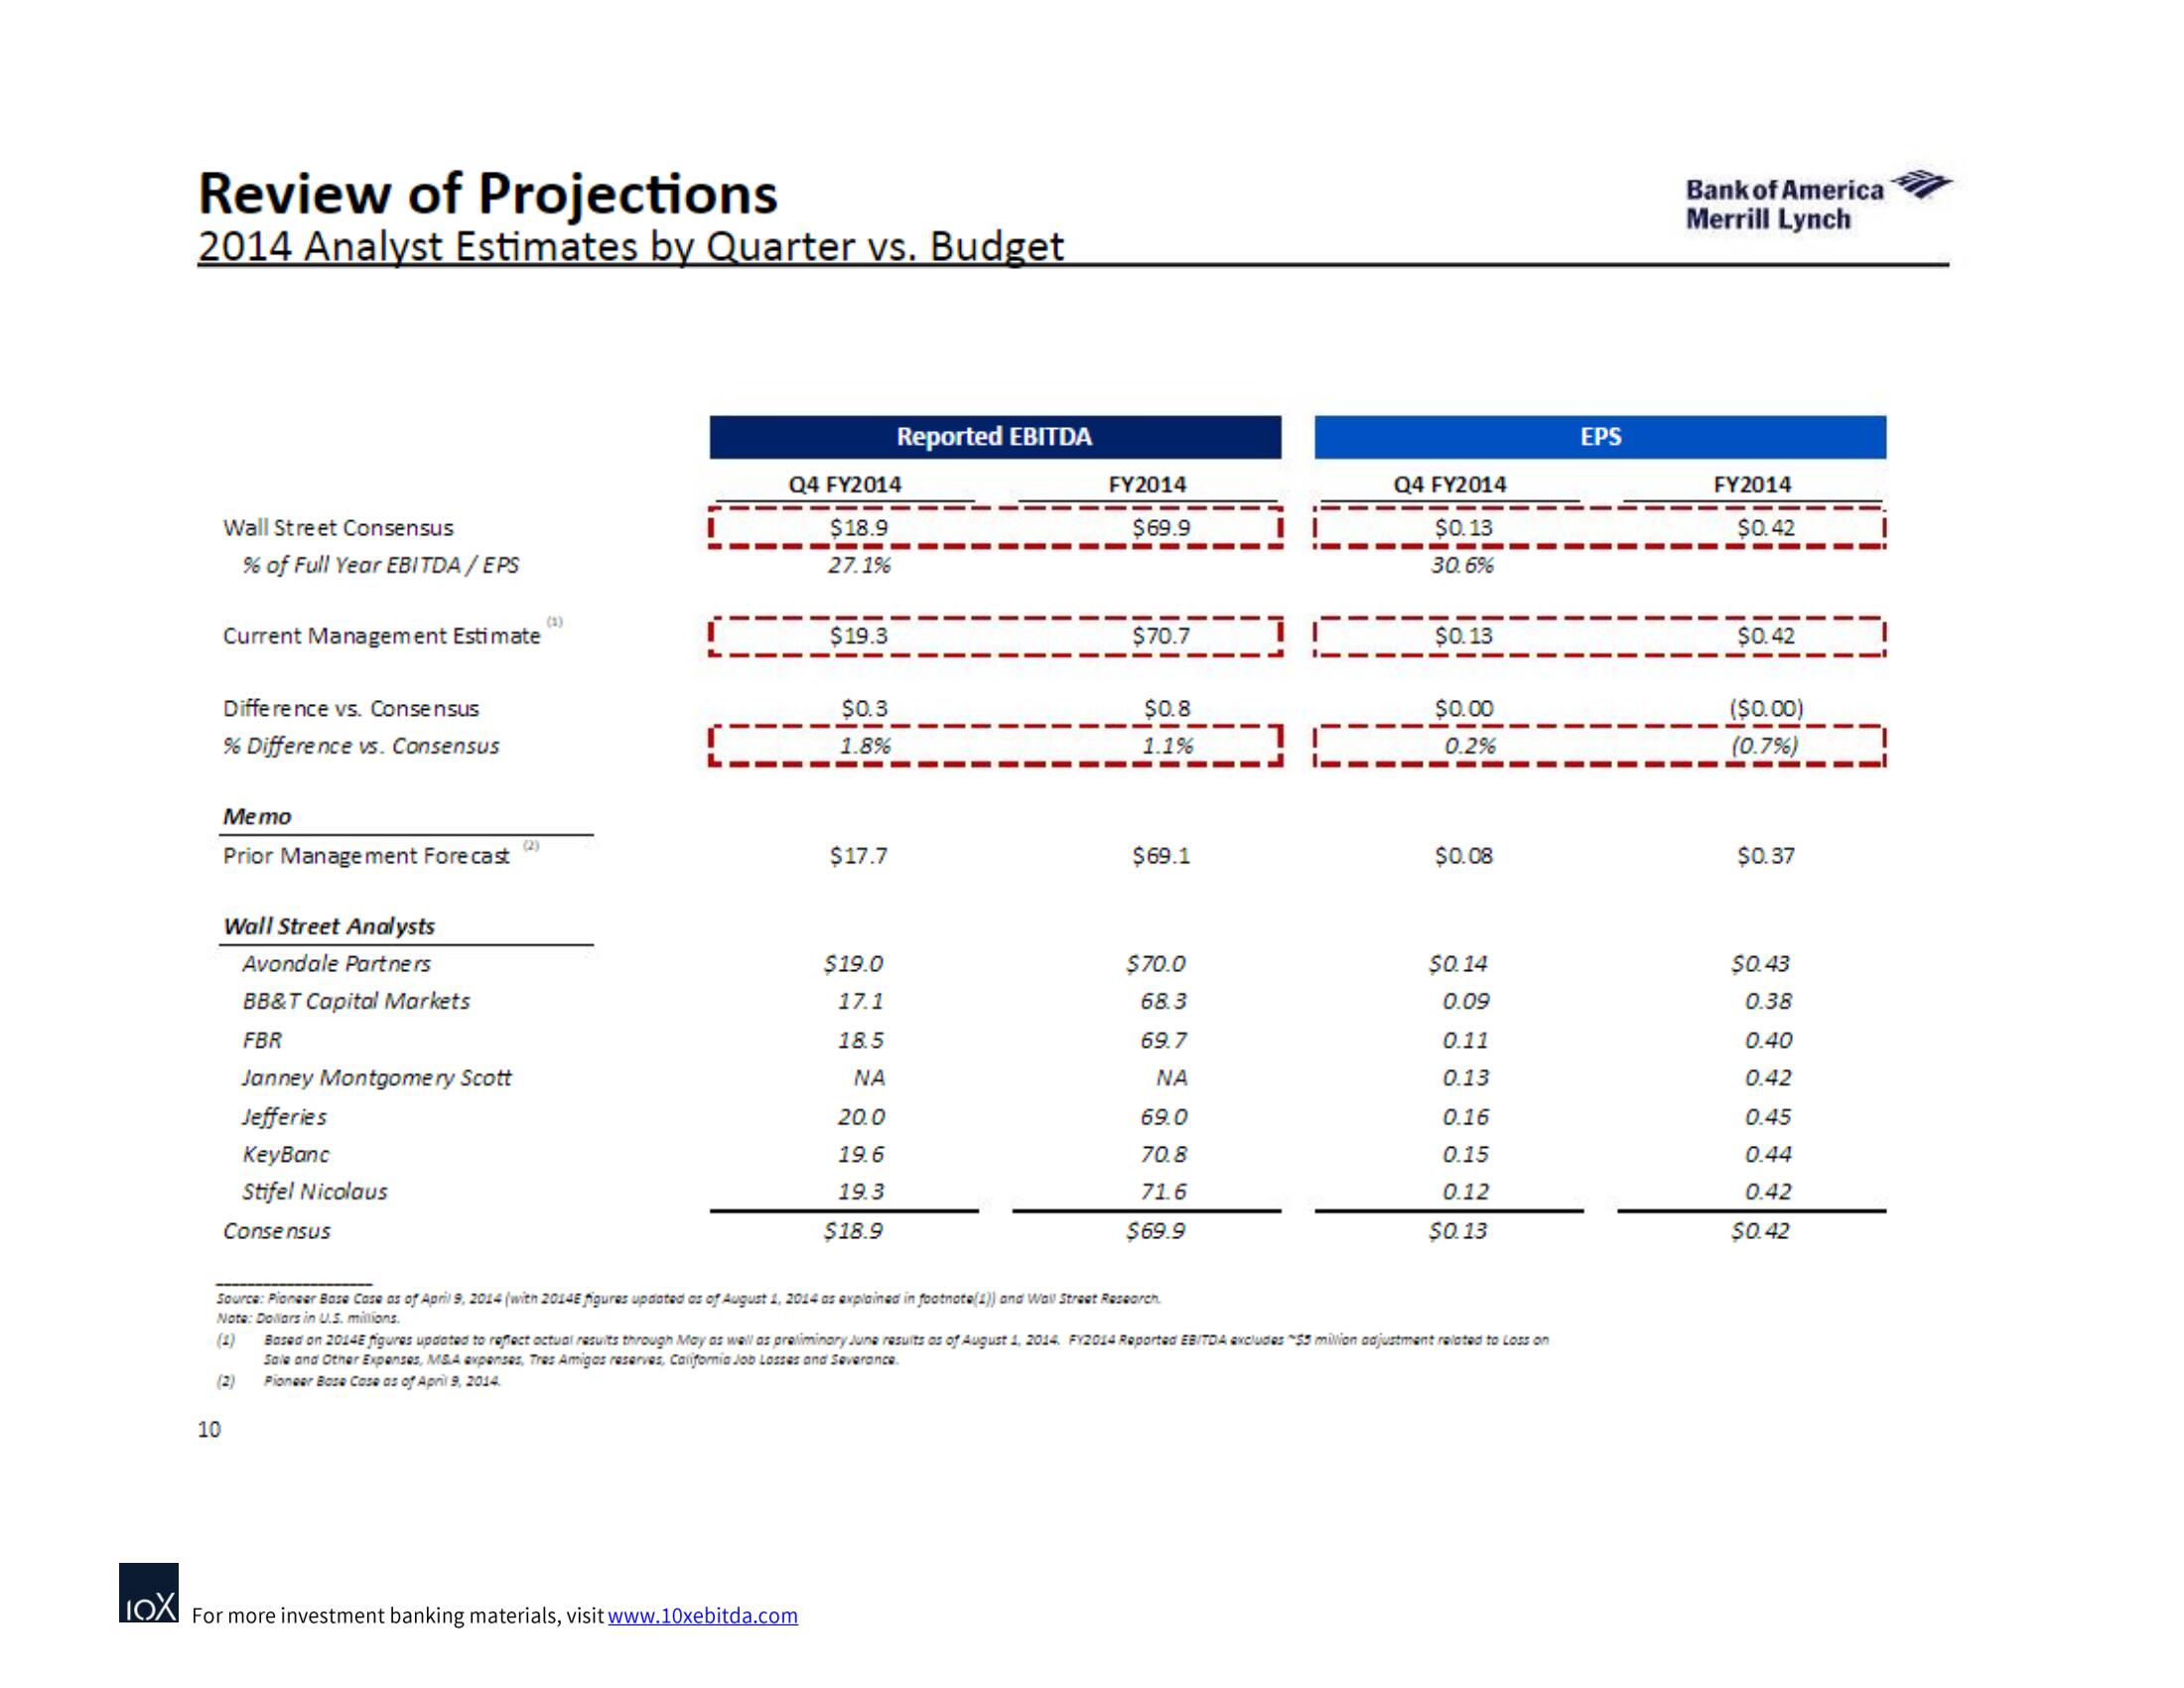
Review of Projections
2014 Analyst Estimates by Quarter vs. Budget
Wall Street Consensus
% of Full Year EBITDA / EPS
Current Management Estimate
10
Difference vs. Consensus
% Difference vs. Consensus
Memo
Prior Management Forecast
Wall Street Analysts
Avondale Partners
BB&T Capital Markets
FBR
(2)
Janney Montgomery Scott
Jefferies
KeyBanc
Stifel Nicolaus
Consensus
(2)
Q4 FY2014
$18.9
——
27.1%
$19.3
$0.3
1.8%
IOX For more investment banking materials, visit www.10xebitda.com
$17.7
Reported EBITDA
$19.0
17.1
18.5
NA
20.0
19.6
19.3
$18.9
FY2014
$69.9
$70.7
$0.8
1.1%
Source: Pioneer Base Case as of April 9, 2014 (with 2014E figures updated as of August 1, 2014 as explained in footnote(1)) and Wall Street Research.
Note: Dollars in U.S. millions.
$69.1
$70.0
68.3
69.7
ΝΑ
69.0
70.8
71.6
$69.9
ir
Q4 FY2014
$0.13
30.6%
$0.13
$0.00
0.2%
$0.08
$0.14
0.09
0.11
0.13
0.16
0.15
0.12
$0.13
Based on 2014E figures updated to reflect actual results through May as well as preliminary June results as of August 1, 2014. FY2014 Reported EBITDA excludes $5 million adjustment related to Loss on
Sale and Other Expenses, M&A expenses, Tres Amigas reserves, California Job Losses and Severance.
Pioneer Base Case as of April 9, 2014.
EPS
Bank of America
Merrill Lynch
FY2014
$0.42
$0.42
($0.00)
(0.7%)
$0.37
$0.43
0.38
0.40
0.42
0.45
0.44
0.42
$0.42View entire presentation