Paysafe Results Presentation Deck
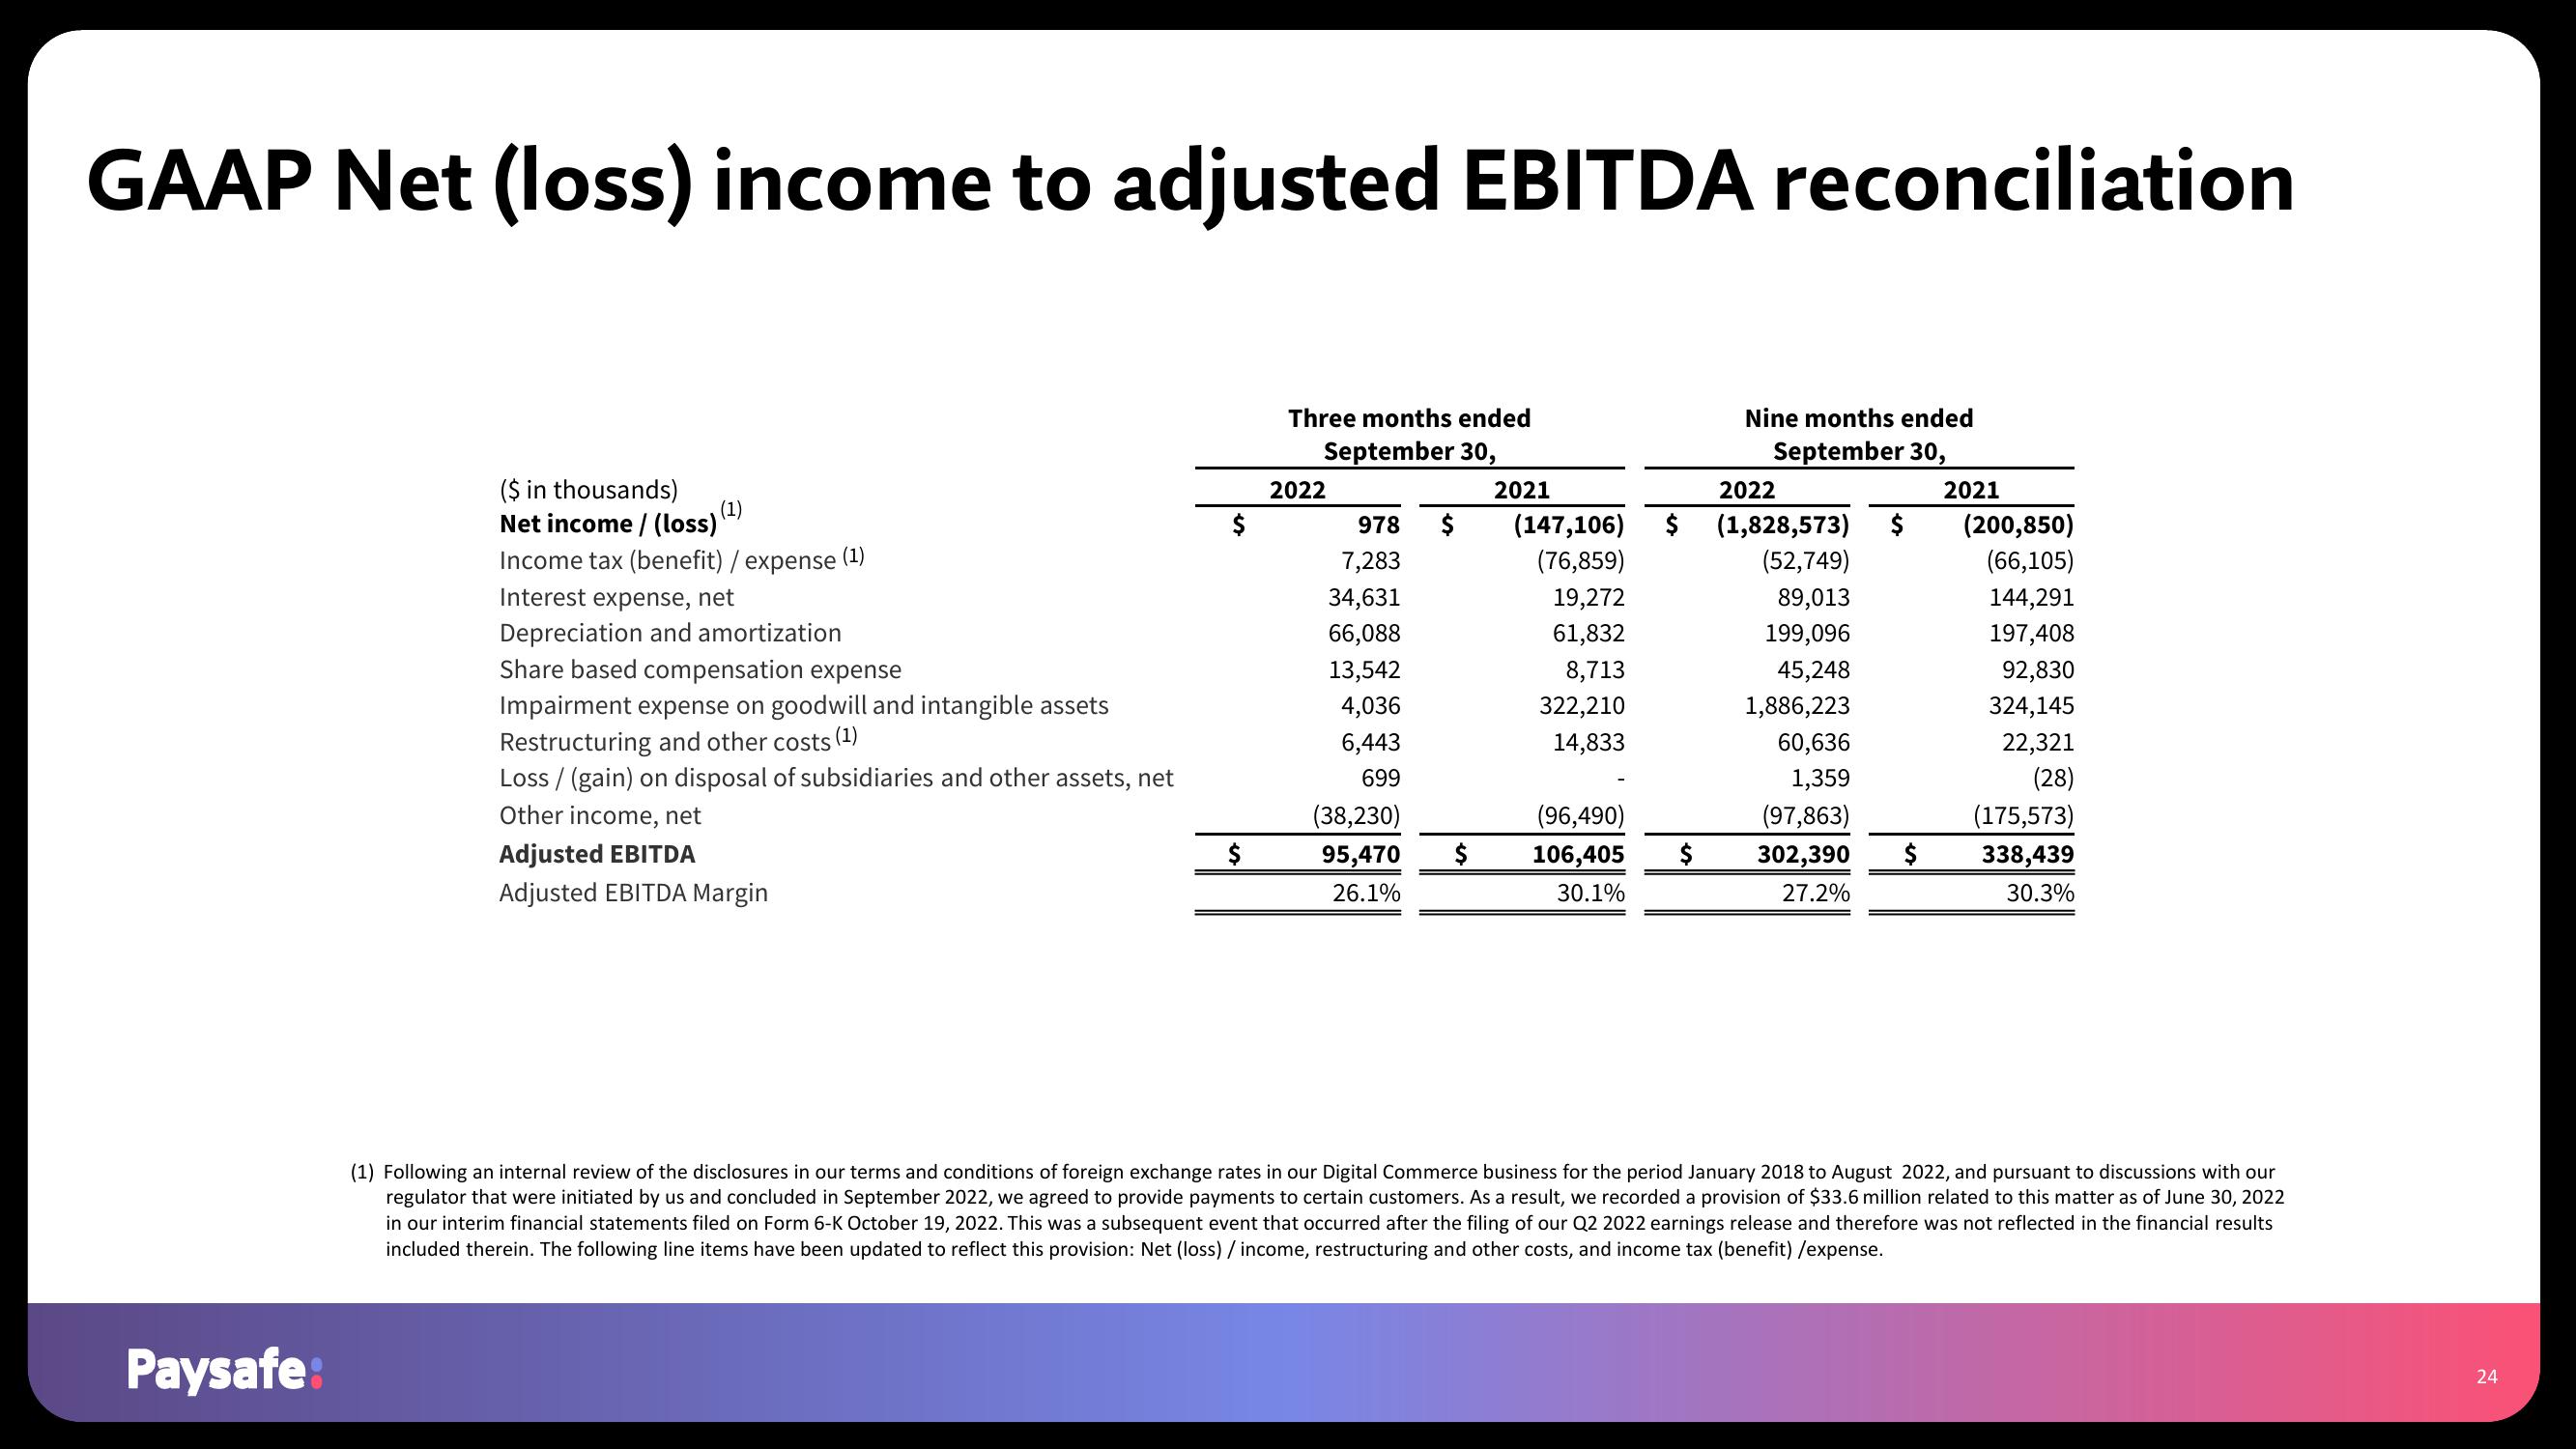
GAAP Net (loss) income to adjusted EBITDA reconciliation
Paysafe:
($ in thousands)
Net income / (loss)
Income tax (benefit) / expense
Interest expense, net
Depreciation and amortization
(1)
(1)
Share based compensation expense
Impairment expense on goodwill and intangible assets
Restructuring and other costs
Loss / (gain) on disposal of subsidiaries and other assets, net
Other income, net
Adjusted EBITDA
Adjusted EBITDA Margin
$
$
Three months ended
September 30,
2022
978 $
7,283
34,631
66,088
13,542
4,036
6,443
699
(38,230)
95,470
26.1%
2021
(147,106)
(76,859)
19,272
61,832
8,713
322,210
14,833
(96,490)
$ 106,405
30.1%
Nine months ended
September 30,
2022
$ (1,828,573) $
(52,749)
89,013
199,096
45,248
1,886,223
60,636
1,359
(97,863)
302,390
27.2%
$
$
2021
(200,850)
(66,105)
144,291
197,408
92,830
324,145
22,321
(28)
(175,573)
338,439
30.3%
(1) Following an internal review of the disclosures in our terms and conditions of foreign exchange rates in our Digital Commerce business for the period January 2018 to August 2022, and pursuant to discussions with our
regulator that were initiated by us and concluded in September 2022, we agreed to provide payments to certain customers. As a result, we recorded a provision of $33.6 million related to this matter as of June 30, 2022
in our interim financial statements filed on Form 6-K October 19, 2022. This was a subsequent event that occurred after the filing of our Q2 2022 earnings release and therefore was not reflected in the financial results
included therein. The following line items have been updated to reflect this provision: Net (loss) / income, restructuring and other costs, and income tax (benefit) /expense.
24View entire presentation