J.P.Morgan Investment Banking Pitch Book
PRELIMINARY VALUATION ANALYSIS
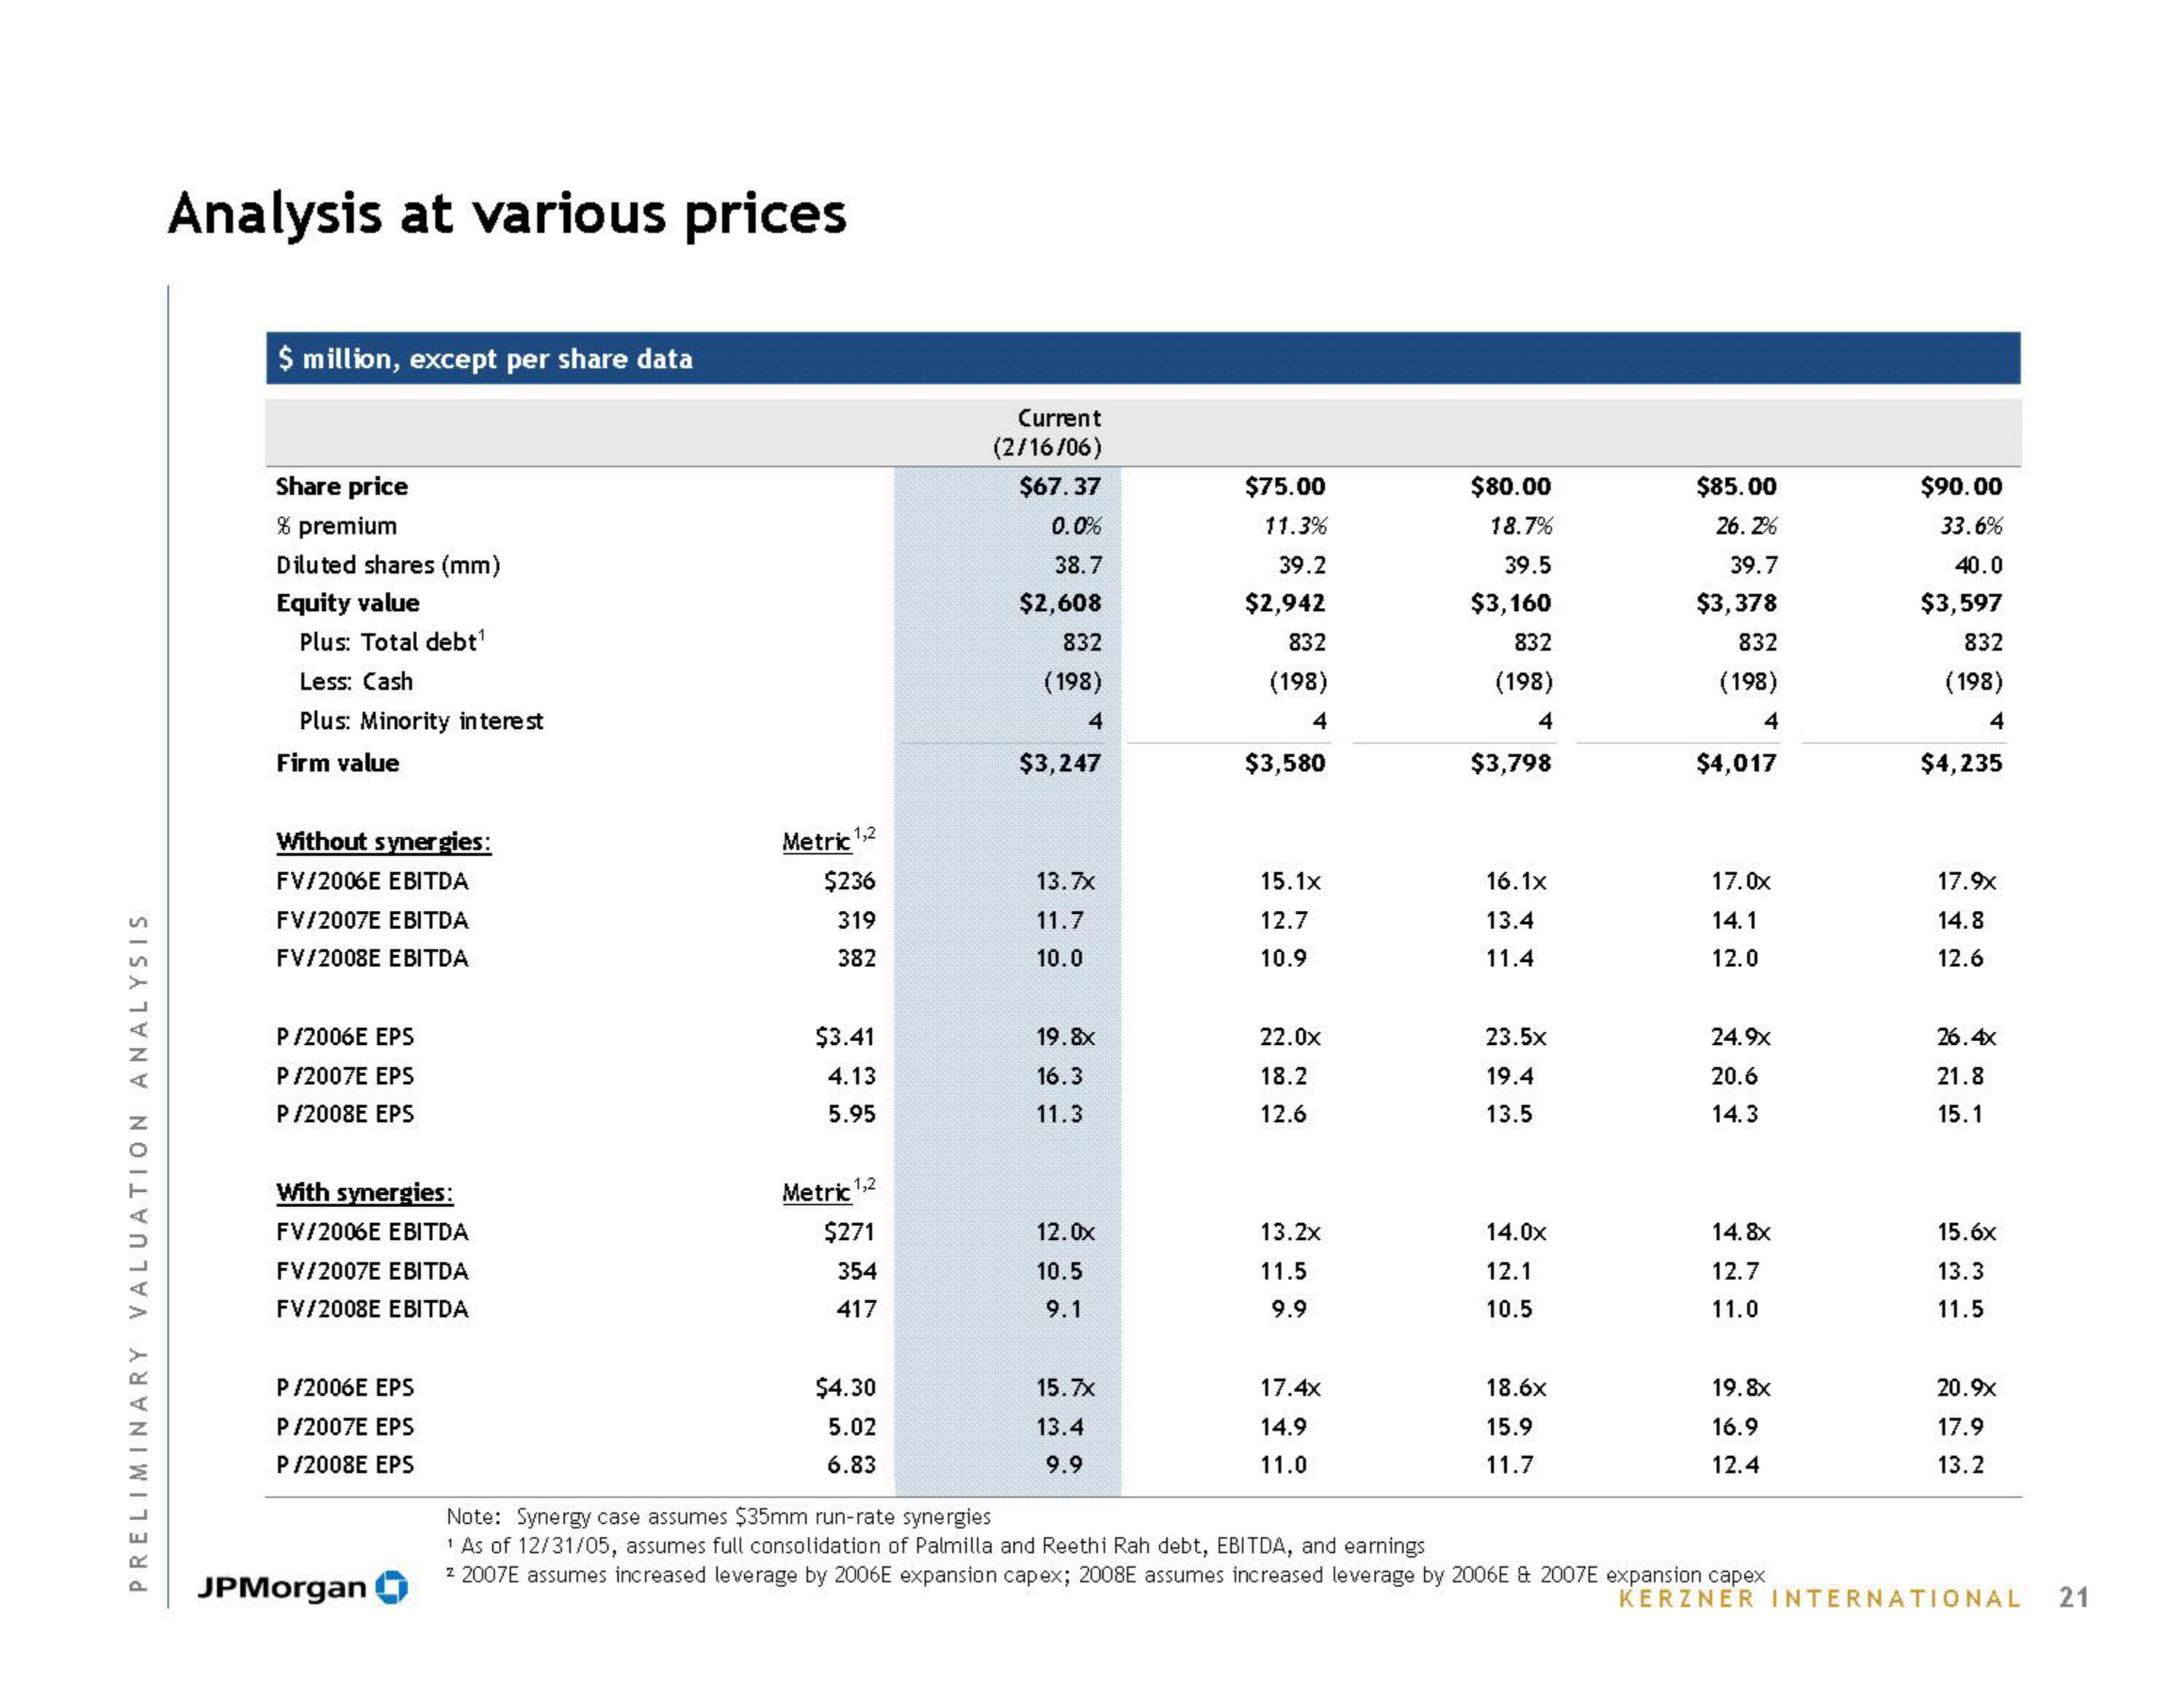
Analysis at various prices
$ million, except per share data
Share price
% premium
Diluted shares (mm)
Equity value
Plus: Total debt¹
Less: Cash
Plus: Minority interest
Firm value
Without synergies:
FV/2006E EBITDA
FV/2007E EBITDA
FV/2008E EBITDA
P/2006E EPS
P/2007E EPS
P/2008E EPS
With synergies:
FV/2006E EBITDA
FV/2007E EBITDA
FV/2008E EBITDA
P/2006E EPS
P/2007E EPS
P/2008E EPS
JPMorgan
Metric
1,2
$236
319
382
$3.41
4.13
5.95
Metric 1,2
$271
354
417
$4.30
5.02
6.83
Current
(2/16/06)
$67.37
0.0%
38.7
$2,608
832
(198)
4
$3,247
13.7x
11.7
10.0
19.8x
16.3
11.3
12.0x
10.5
9.1
15.7x
13.4
9.9
$75.00
11.3%
39.2
$2,942
832
(198)
4
$3,580
15.1x
12.7
10.9
22.0x
18.2
12.6
13.2x
11.5
9.9
17.4x
14.9
11.0
$80.00
18.7%
39.5
$3,160
832
(198)
4
$3,798
16.1x
13.4
11.4
23.5x
19.4
13.5
14.0x
12.1
10.5
18.6x
15.9
11.7
$85.00
26.2%
39.7
$3,378
832
(198)
4
$4,017
17.0x
14.1
12.0
24.9x
20.6
14.3
14.8x
12.7
11.0
19.8x
16.9
12.4
Note: Synergy case assumes $35mm run-rate synergies
1 As of 12/31/05, assumes full consolidation of Palmilla and Reethi Rah debt, EBITDA, and earnings
2 2007E assumes increased leverage by 2006E expansion capex; 2008E assumes increased leverage by 2006E & 2007E expansion capex
$90.00
33.6%
40.0
$3,597
832
(198)
4
$4,235
17.9x
14.8
12.6
26.4x
21.8
15.1
15.6x
13.3
11.5
20.9x
17.9
13.2
KERZNER INTERNATIONAL
21View entire presentation