Bank of America Investment Banking Pitch Book
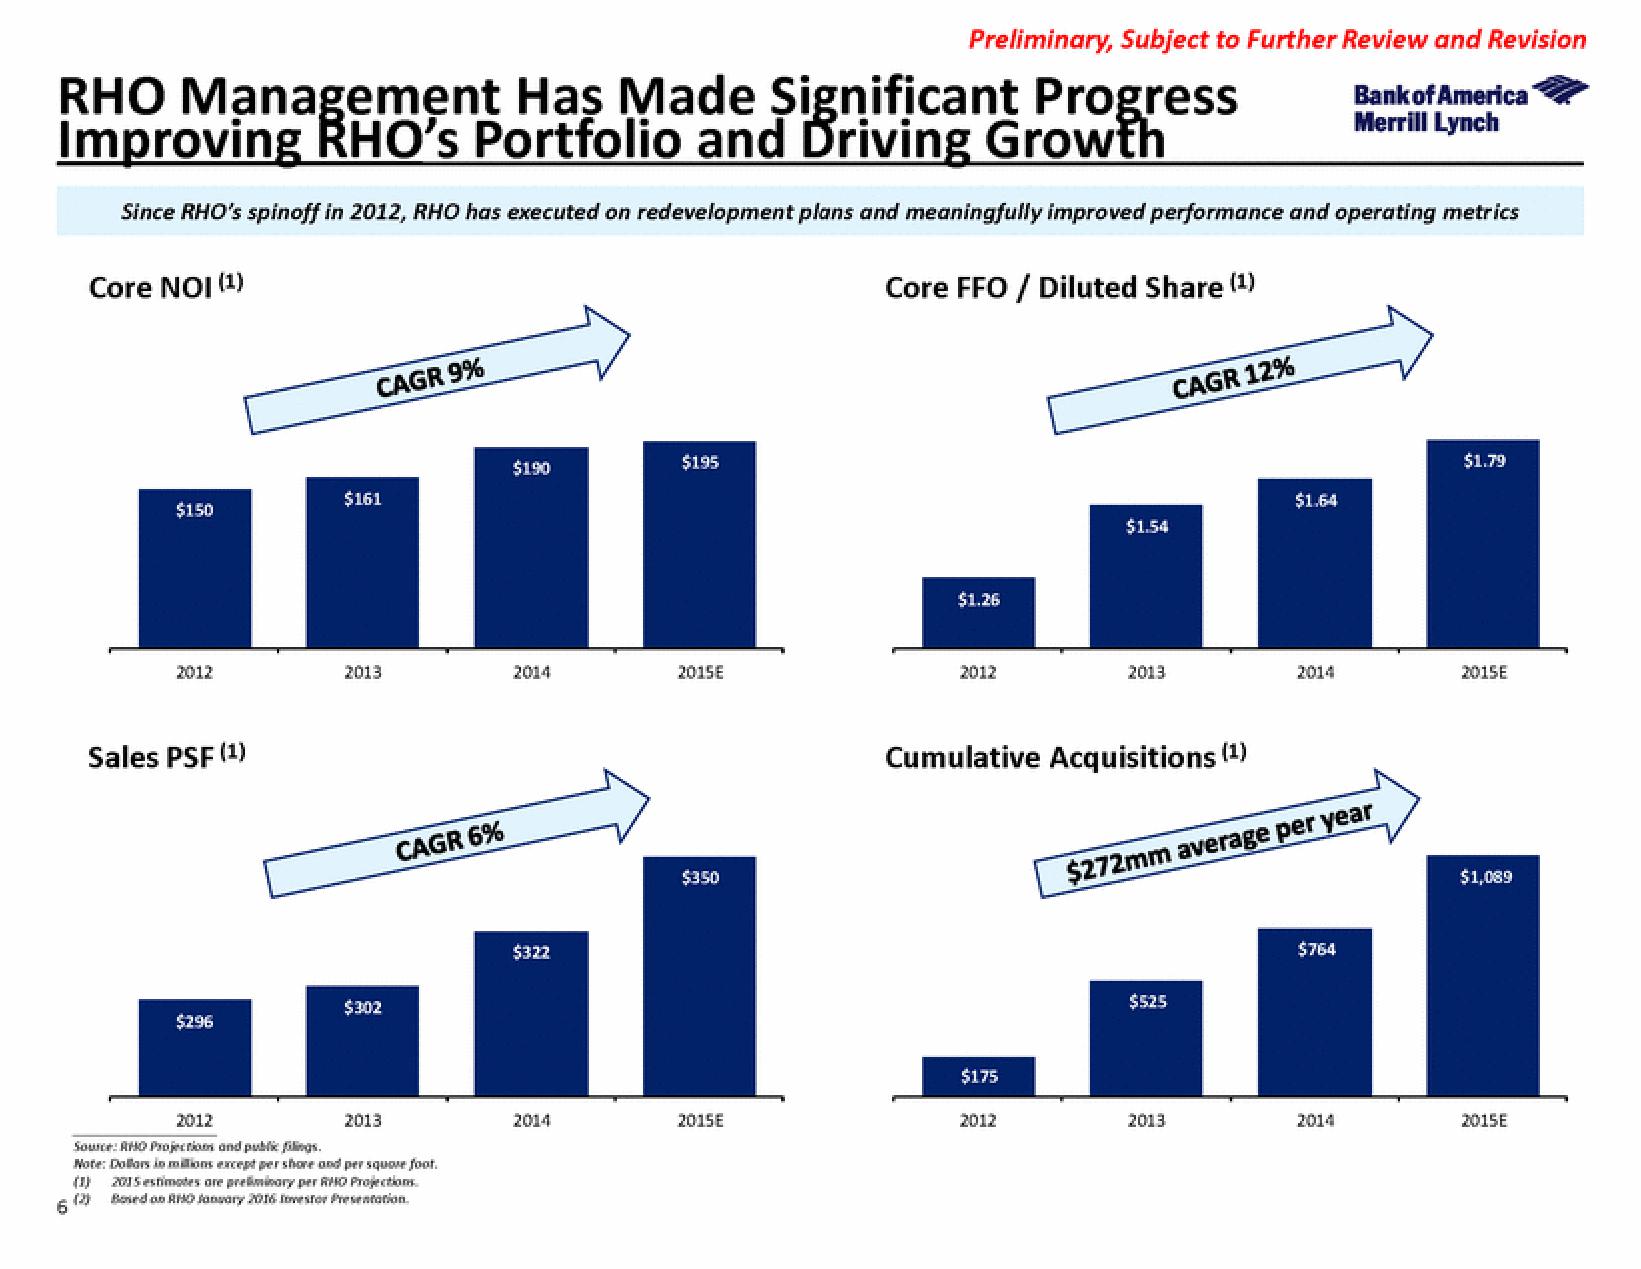
RHO Management Has Made Significant Progress
Improving RHO's Portfolio and Driving Growth
Since RHO's spinoff in 2012, RHO has executed on redevelopment plans and meaningfully improved performance and operating metrics
6
Core NOI (1)
$150
2012
Sales PSF (1)
$296
CAGR 9%
$161
2013
$302
2013
CAGR 6%
2012
Source: AHO Projections and public filings.
Note: Dollars in millions except per shore and per square foot.
(
2015 estimates are preliminary per RHO Projection
Based on RHO January 2016 Investor Presentation.
$190
$322
$19
2015E
$350
Preliminary, Subject to Further Review and Revision
Bank of America
Merrill Lynch
2015E
Core FFO / Diluted Share (¹)
$1.26
2012
$175
$1.54
2012
2013
Cumulative Acquisitions (¹)
CAGR 12%
$525
2013
$1.64
$272mm average per year
2014
$764
2014
$1.79
2015E
$1,089
2015EView entire presentation