XP Inc Results Presentation Deck
Non-GAAP Financial Information
Floating and Adjusted Gross Financial Assets
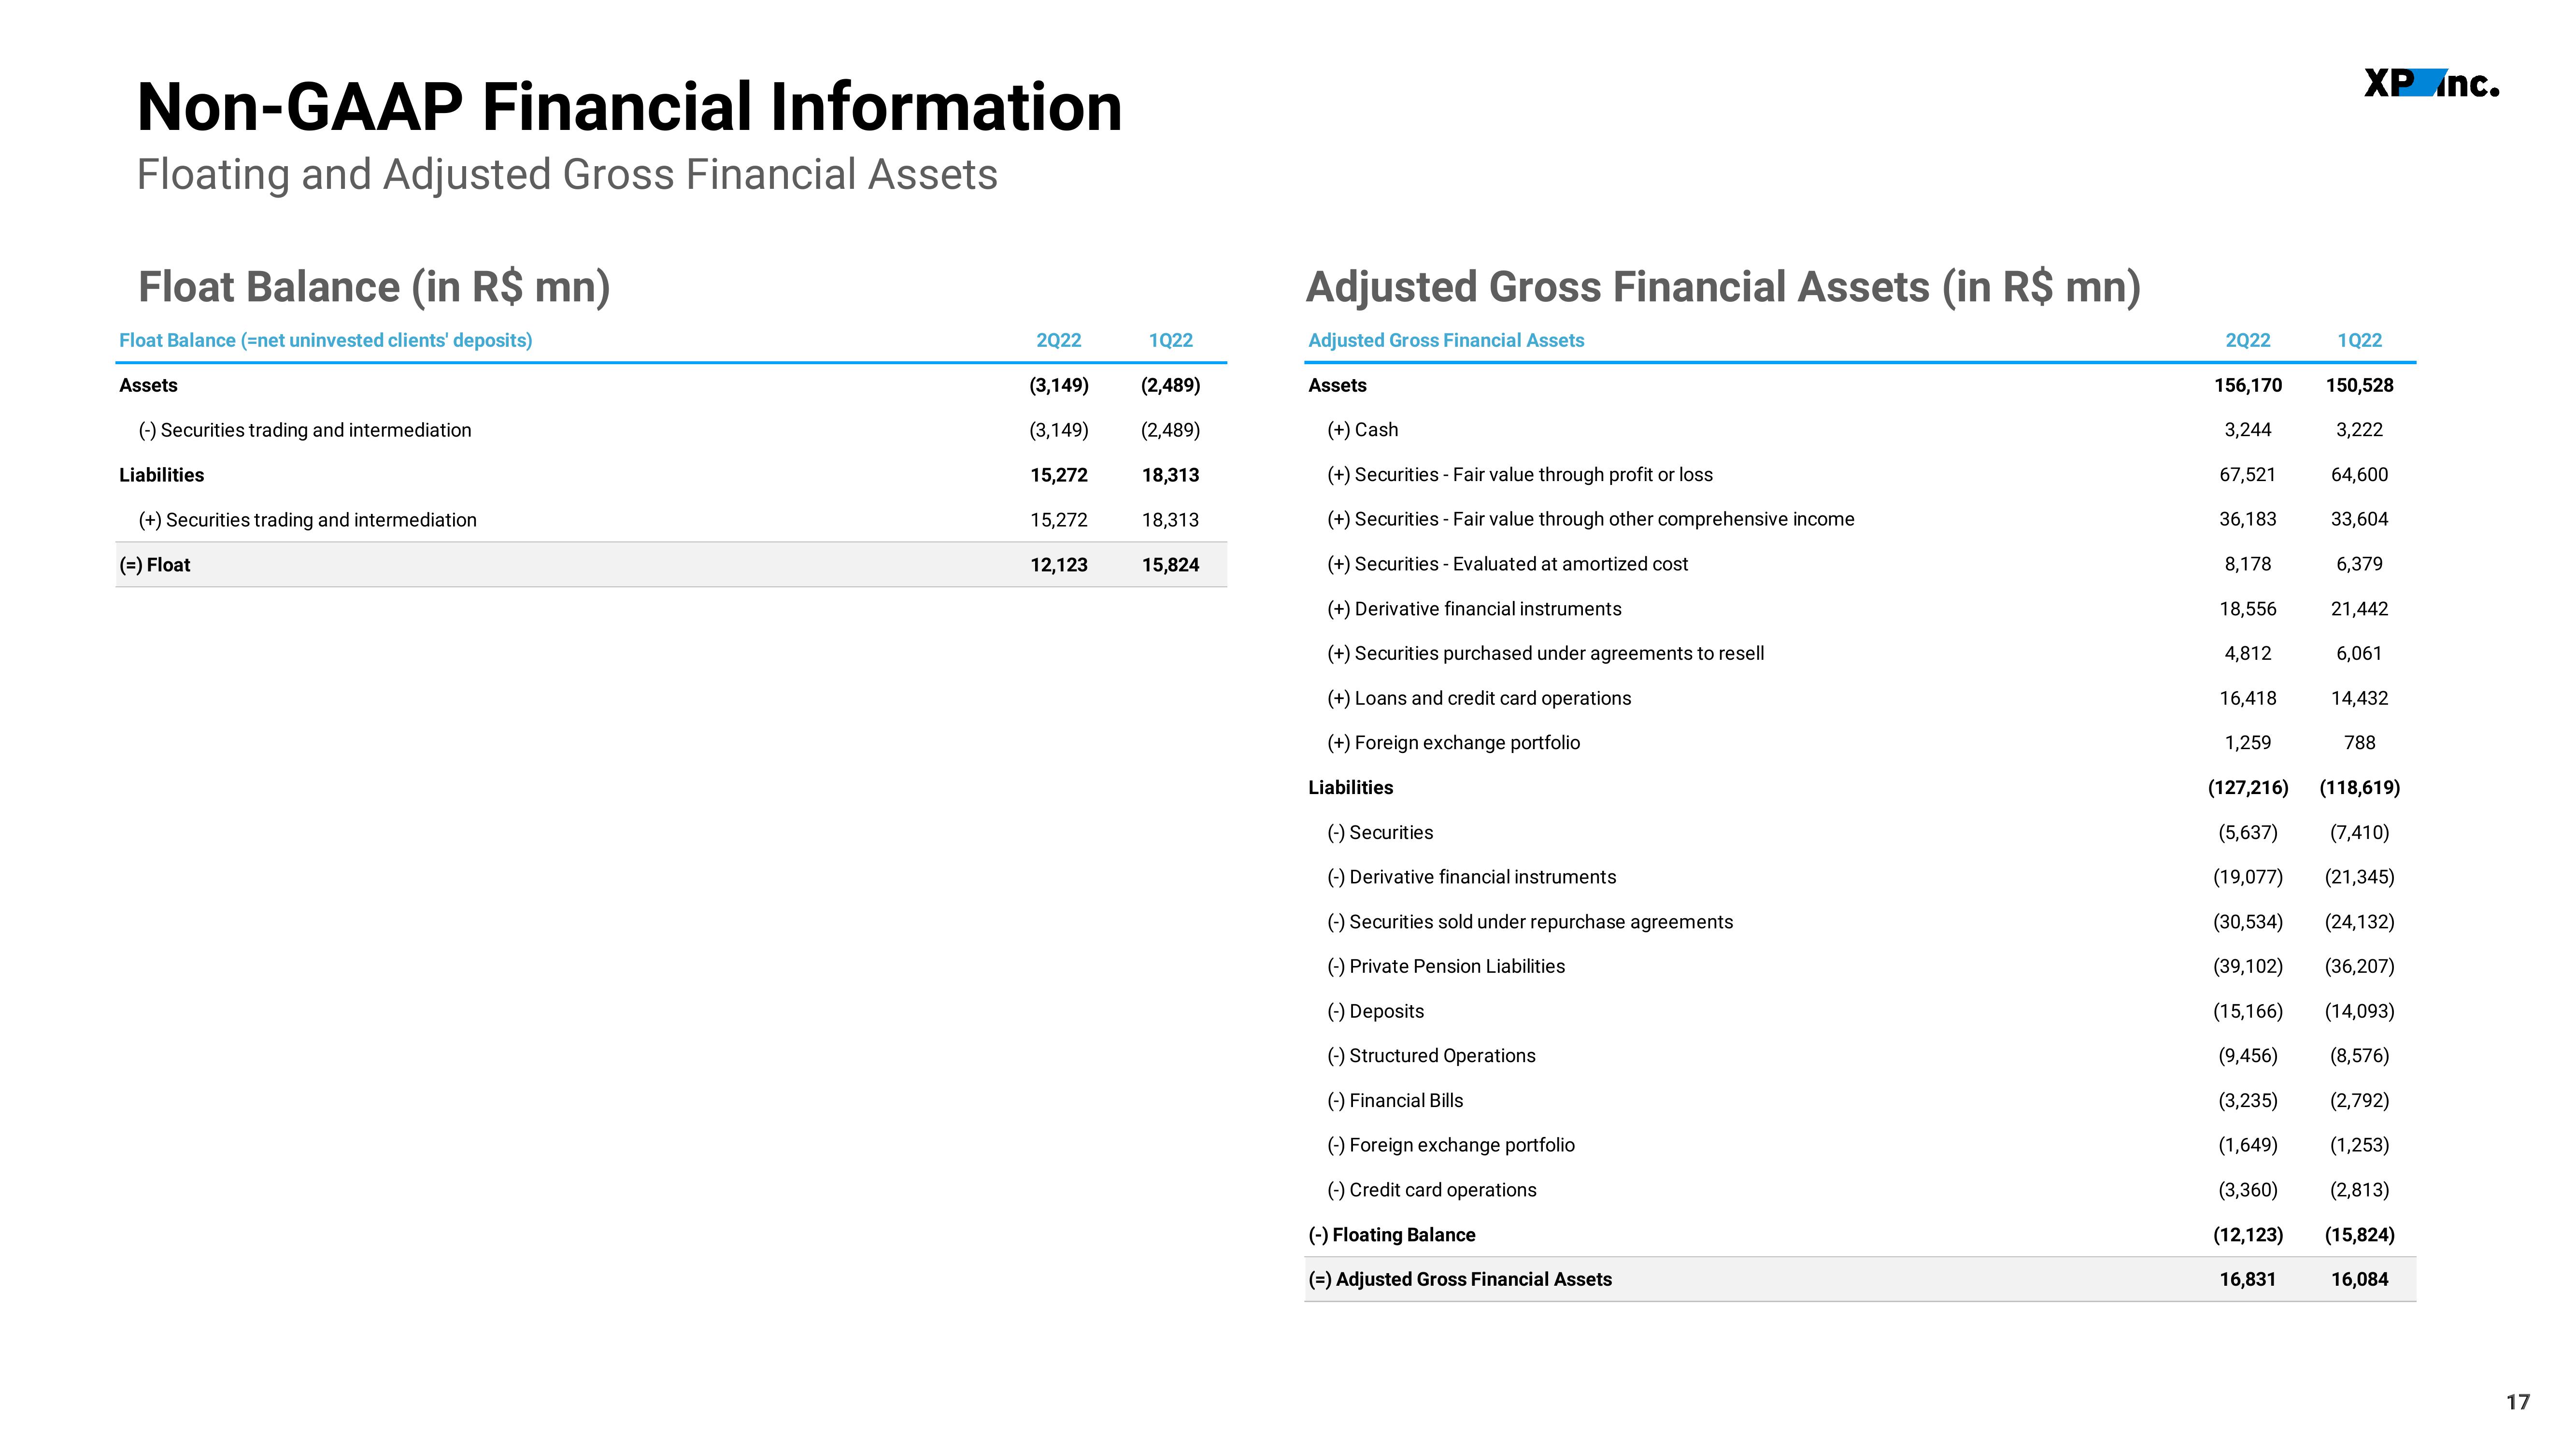
Float Balance (in R$ mn)
Float Balance (=net uninvested clients' deposits)
Assets
(-) Securities trading and intermediation.
Liabilities
(+) Securities trading and intermediation
(=) Float
2022
(3,149)
(3,149)
15,272
15,272
12,123
1Q22
(2,489)
(2,489)
18,313
18,313
15,824
Adjusted Gross Financial Assets (in R$ mn)
Adjusted Gross Financial Assets
Assets
(+) Cash
(+) Securities - Fair value through profit or loss
(+) Securities - Fair value through other comprehensive income
(+) Securities - Evaluated at amortized cost
(+) Derivative financial instruments
(+) Securities purchased under agreements to resell
(+) Loans and credit card operations
(+) Foreign exchange portfolio
Liabilities
(-) Securities
(-) Derivative financial instruments
(-) Securities sold under repurchase agreements
(-) Private Pension Liabilities
(-) Deposits
(-) Structured Operations
(-) Financial Bills
(-) Foreign exchange portfolio
(-) Credit card operations
(-) Floating Balance
(=) Adjusted Gross Financial Assets
2022
156,170
3,244
67,521
36,183
8,178
18,556
4,812
16,418
1,259
(127,216)
(5,637)
(19,077)
(30,534)
(39,102)
(15,166)
(9,456)
(3,235)
(1,649)
(3,360)
(12,123)
16,831
XP Inc.
1Q22
150,528
3,222
64,600
33,604
6,379
21,442
6,061
14,432
788
(118,619)
(7,410)
(21,345)
(24,132)
(36,207)
(14,093)
(8,576)
(2,792)
(1,253)
(2,813)
(15,824)
16,084
17View entire presentation