Melrose Mergers and Acquisitions Presentation Deck
Interim results: Melrose Group cash generation in the first half
Melrose
Free cash flow¹
Cash flow
£m
Adjusted EBITDA²
Lease obligation payments
Positive non-cash impact from loss-making contracts
Movement in working capital
Adjusted operating cash flow (pre-capex)
Net capital expenditure¹
Net interest and tax paid
Defined benefit pension contributions - ongoing contributions
Trading net other
Dividend income from equity accounted investments
Cash flows from operations discontinued in the Period
Adjusted free cash flow¹
Restructuring
Free cash flow¹
■
I
I
Group
H1 2022
349
(24)
(17)
(195)
113
(79)
(95)
(11)
(24)
29
16
(51)
(53)
(104)
Buy
Improve
Sell
Reconciliation of opening to closing net debt¹
Reconciliation of net debt¹
£m
Net debt¹ brought forward
Adverse foreign exchange movement
Net debt¹ at 30 June 2022 foreign exchange rates
Net cash flow from acquisition and disposal related activities
Free cash flow¹ in the Period
Dividends paid to shareholders
Buy back of own shares
Net debt¹ at 30 June 2022
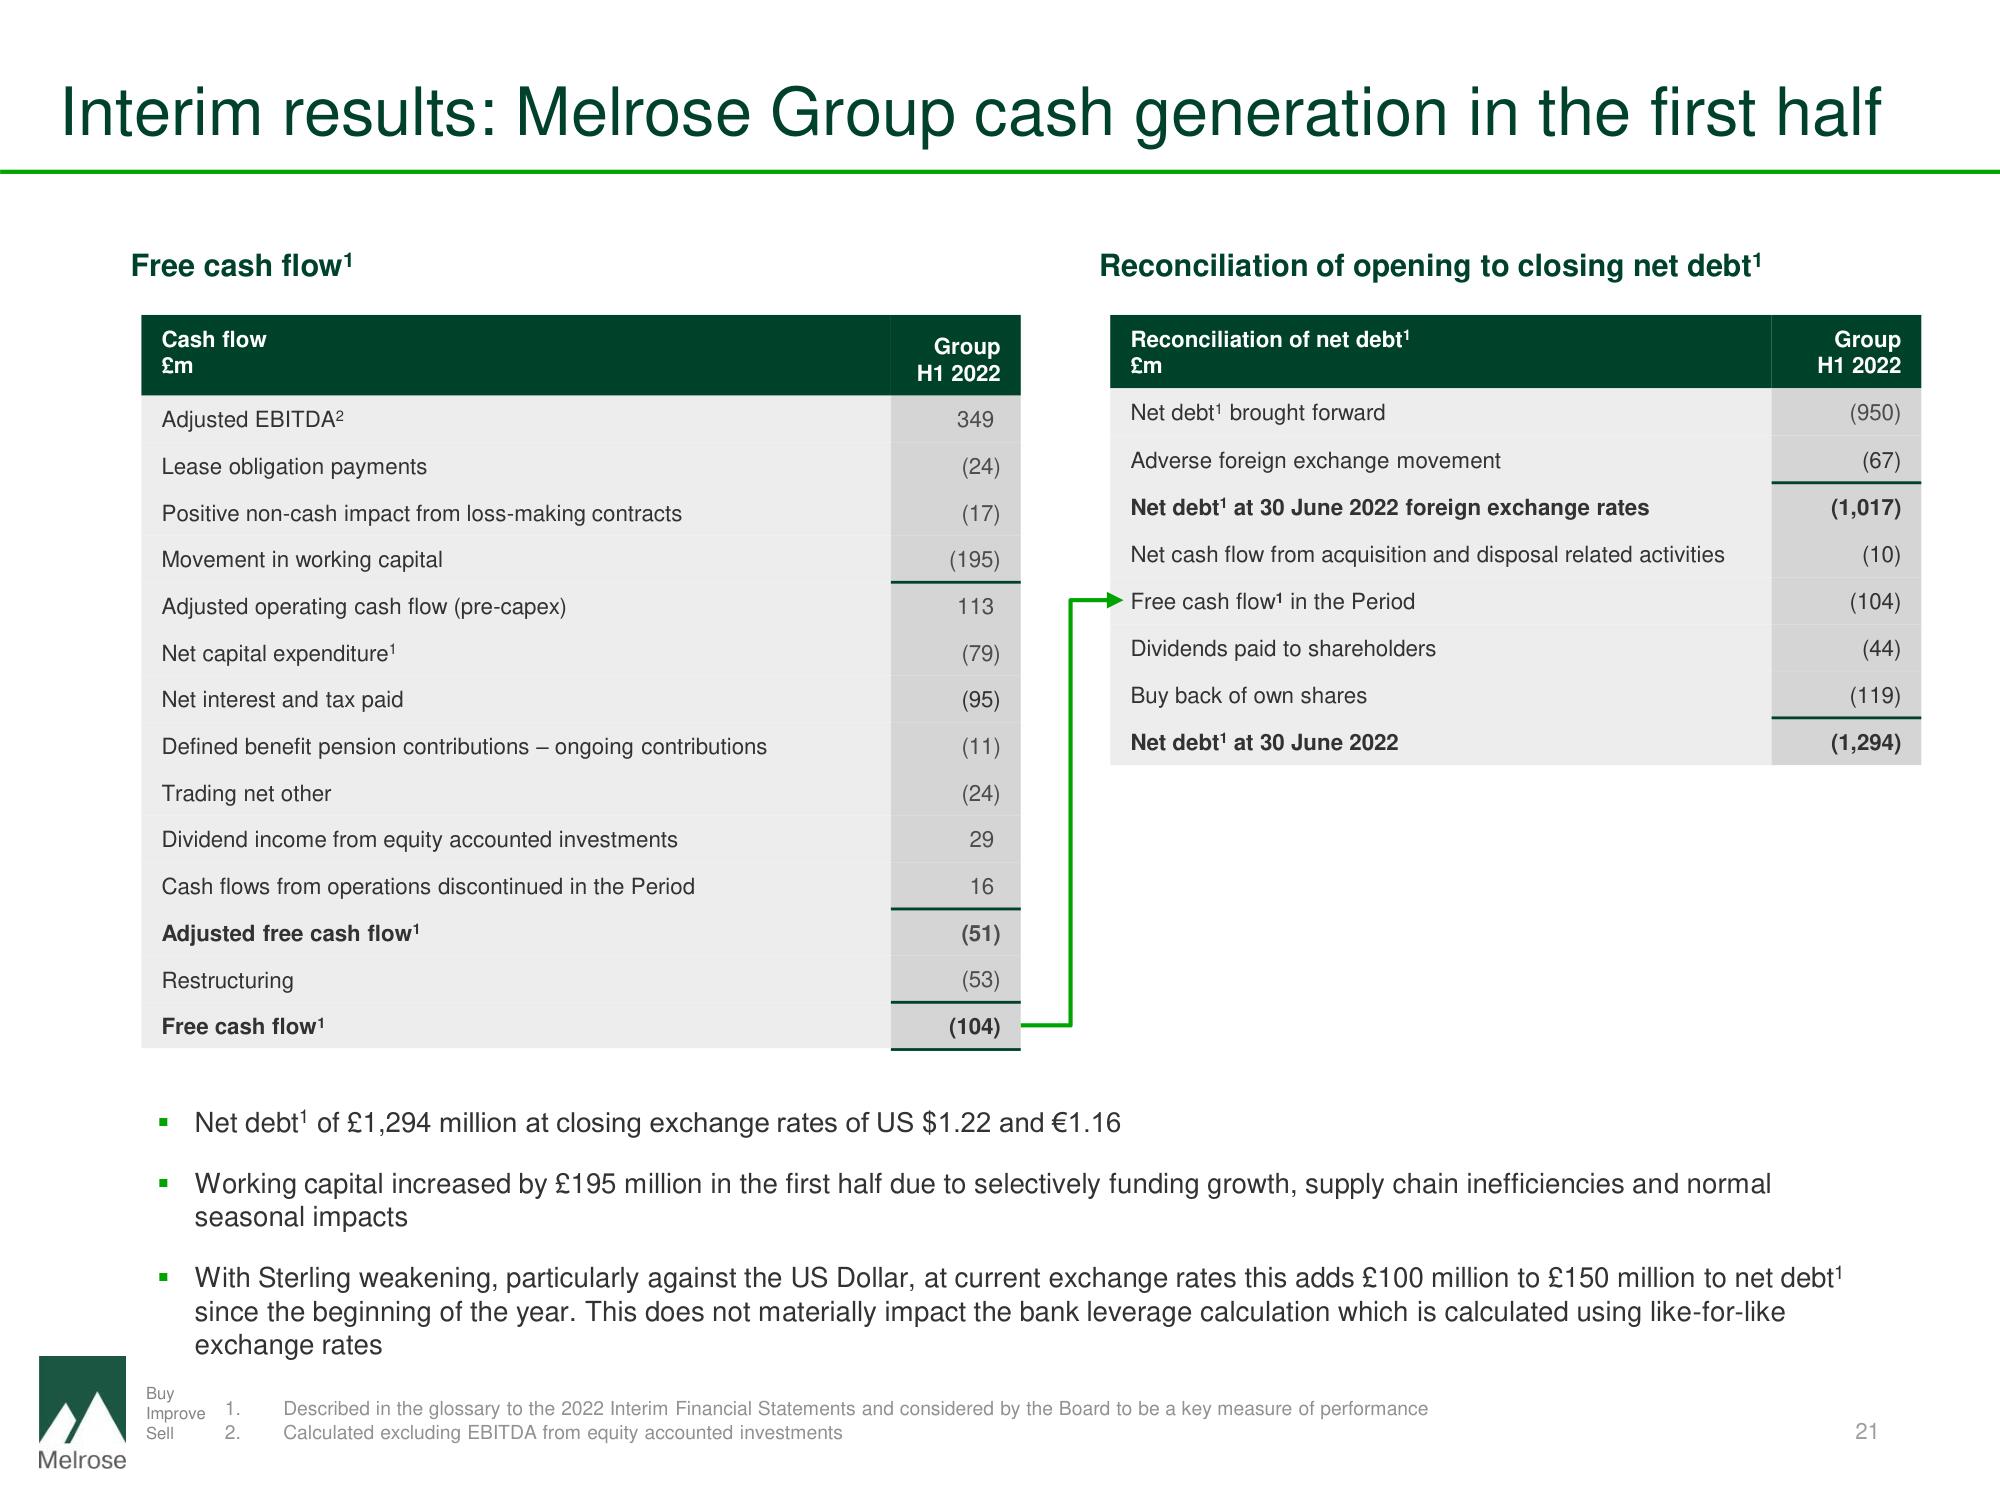
Net debt¹ of £1,294 million at closing exchange rates of US $1.22 and €1.16
Working capital increased by £195 million in the first half due to selectively funding growth, supply chain inefficiencies and normal
seasonal impacts
With Sterling weakening, particularly against the US Dollar, at current exchange rates this adds £100 million to £150 million to net debt¹
since the beginning of the year. This does not materially impact the bank leverage calculation which is calculated using like-for-like
exchange rates
Group
H1 2022
(950)
(67)
(1,017)
(10)
(104)
(44)
(119)
(1,294)
1.
Described in the glossary to the 2022 Interim Financial Statements and considered by the Board to be a key measure of performance
2. Calculated excluding EBITDA from equity accounted investments
21View entire presentation