LiveVox Results Presentation Deck
Q1 2023
CY 2022
5
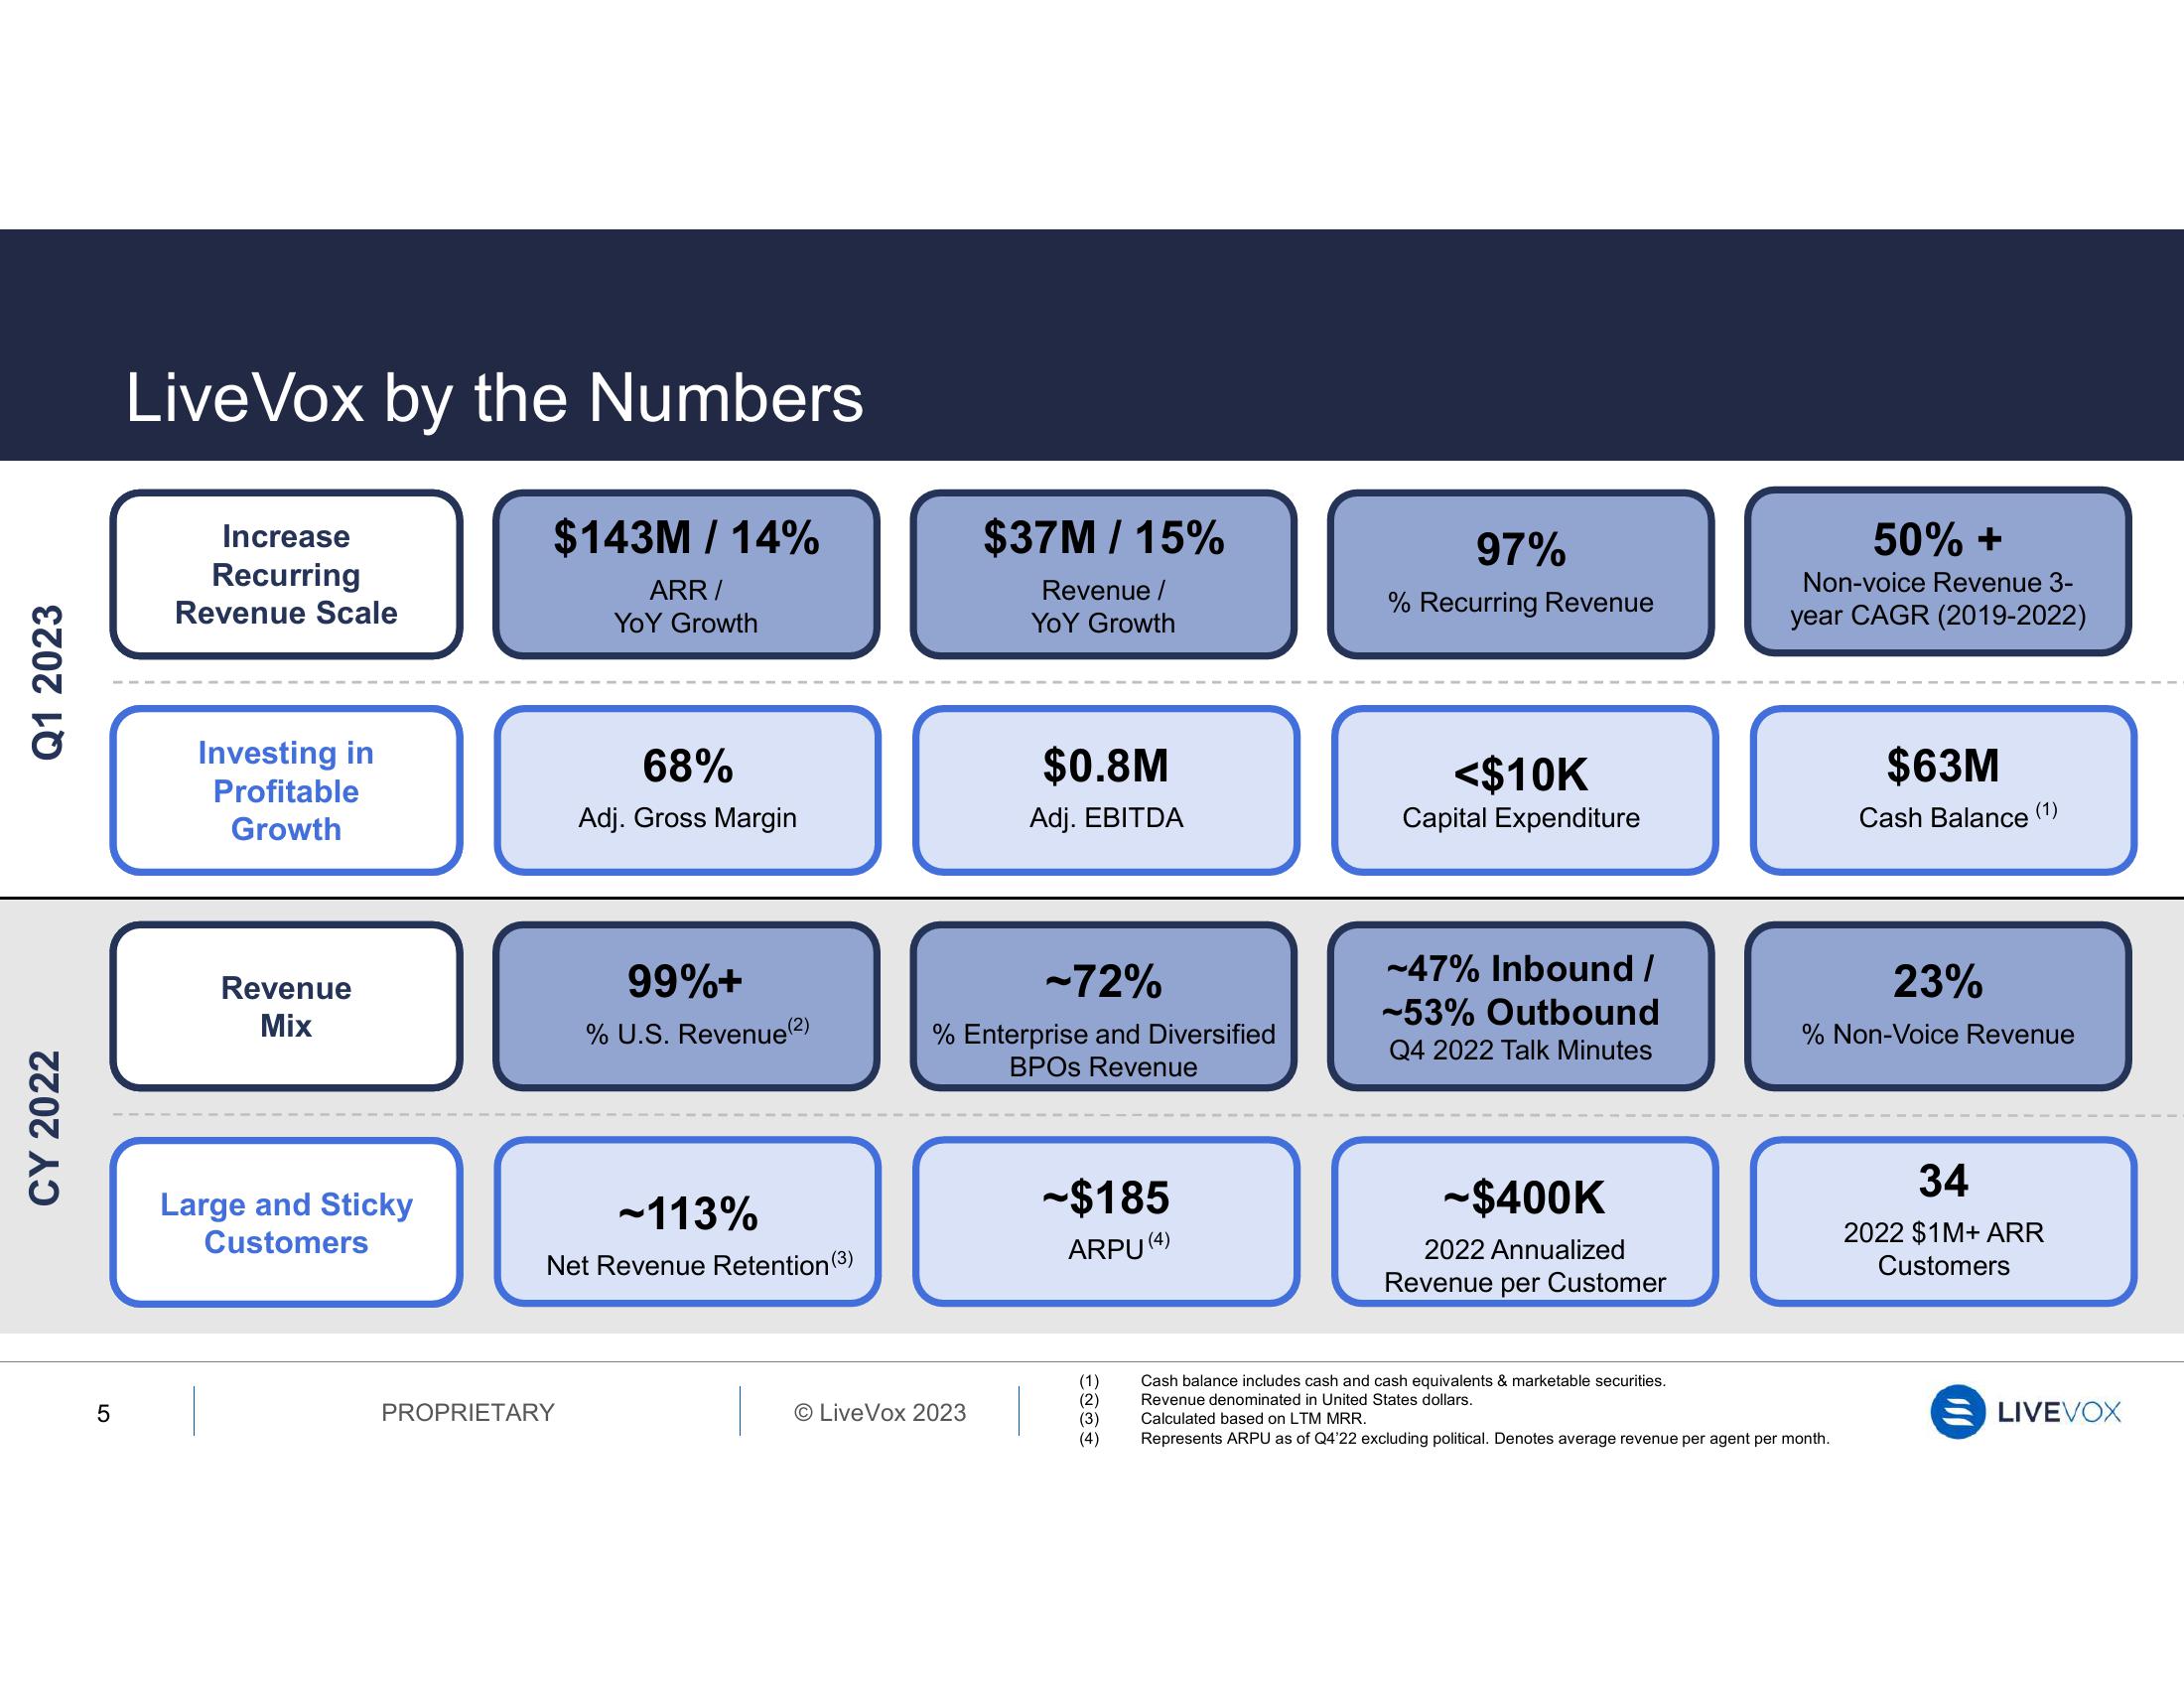
Live Vox by the Numbers
Increase
Recurring
Revenue Scale
Investing in
Profitable
Growth
Revenue
Mix
Large and Sticky
Customers
$143M / 14%
ARR/
YoY Growth
68%
Adj. Gross Margin
PROPRIETARY
99%+
% U.S. Revenue(²)
~113%
Net Revenue Retention (3)
$37M / 15%
Revenue /
YOY Growth
O LiveVox 2023
$0.8M
Adj. EBITDA
-72%
% Enterprise and Diversified
BPOS Revenue
-$185
ARPU (4)
(1)
97%
% Recurring Revenue
<$10K
Capital Expenditure
-47% Inbound /
~53% Outbound
Q4 2022 Talk Minutes
-$400K
2022 Annualized
Revenue per Customer
50% +
Non-voice Revenue 3-
year CAGR (2019-2022)
$63M
Cash Balance
Cash balance includes cash and cash equivalents & marketable securities.
Revenue denominated in United States dollars.
Calculated based on LTM MRR.
Represents ARPU as of Q4'22 excluding political. Denotes average revenue per agent per month.
23%
(1)
% Non-Voice Revenue
34
2022 $1M+ ARR
Customers
LIVEVOXView entire presentation