Clover Health Investor Presentation Deck
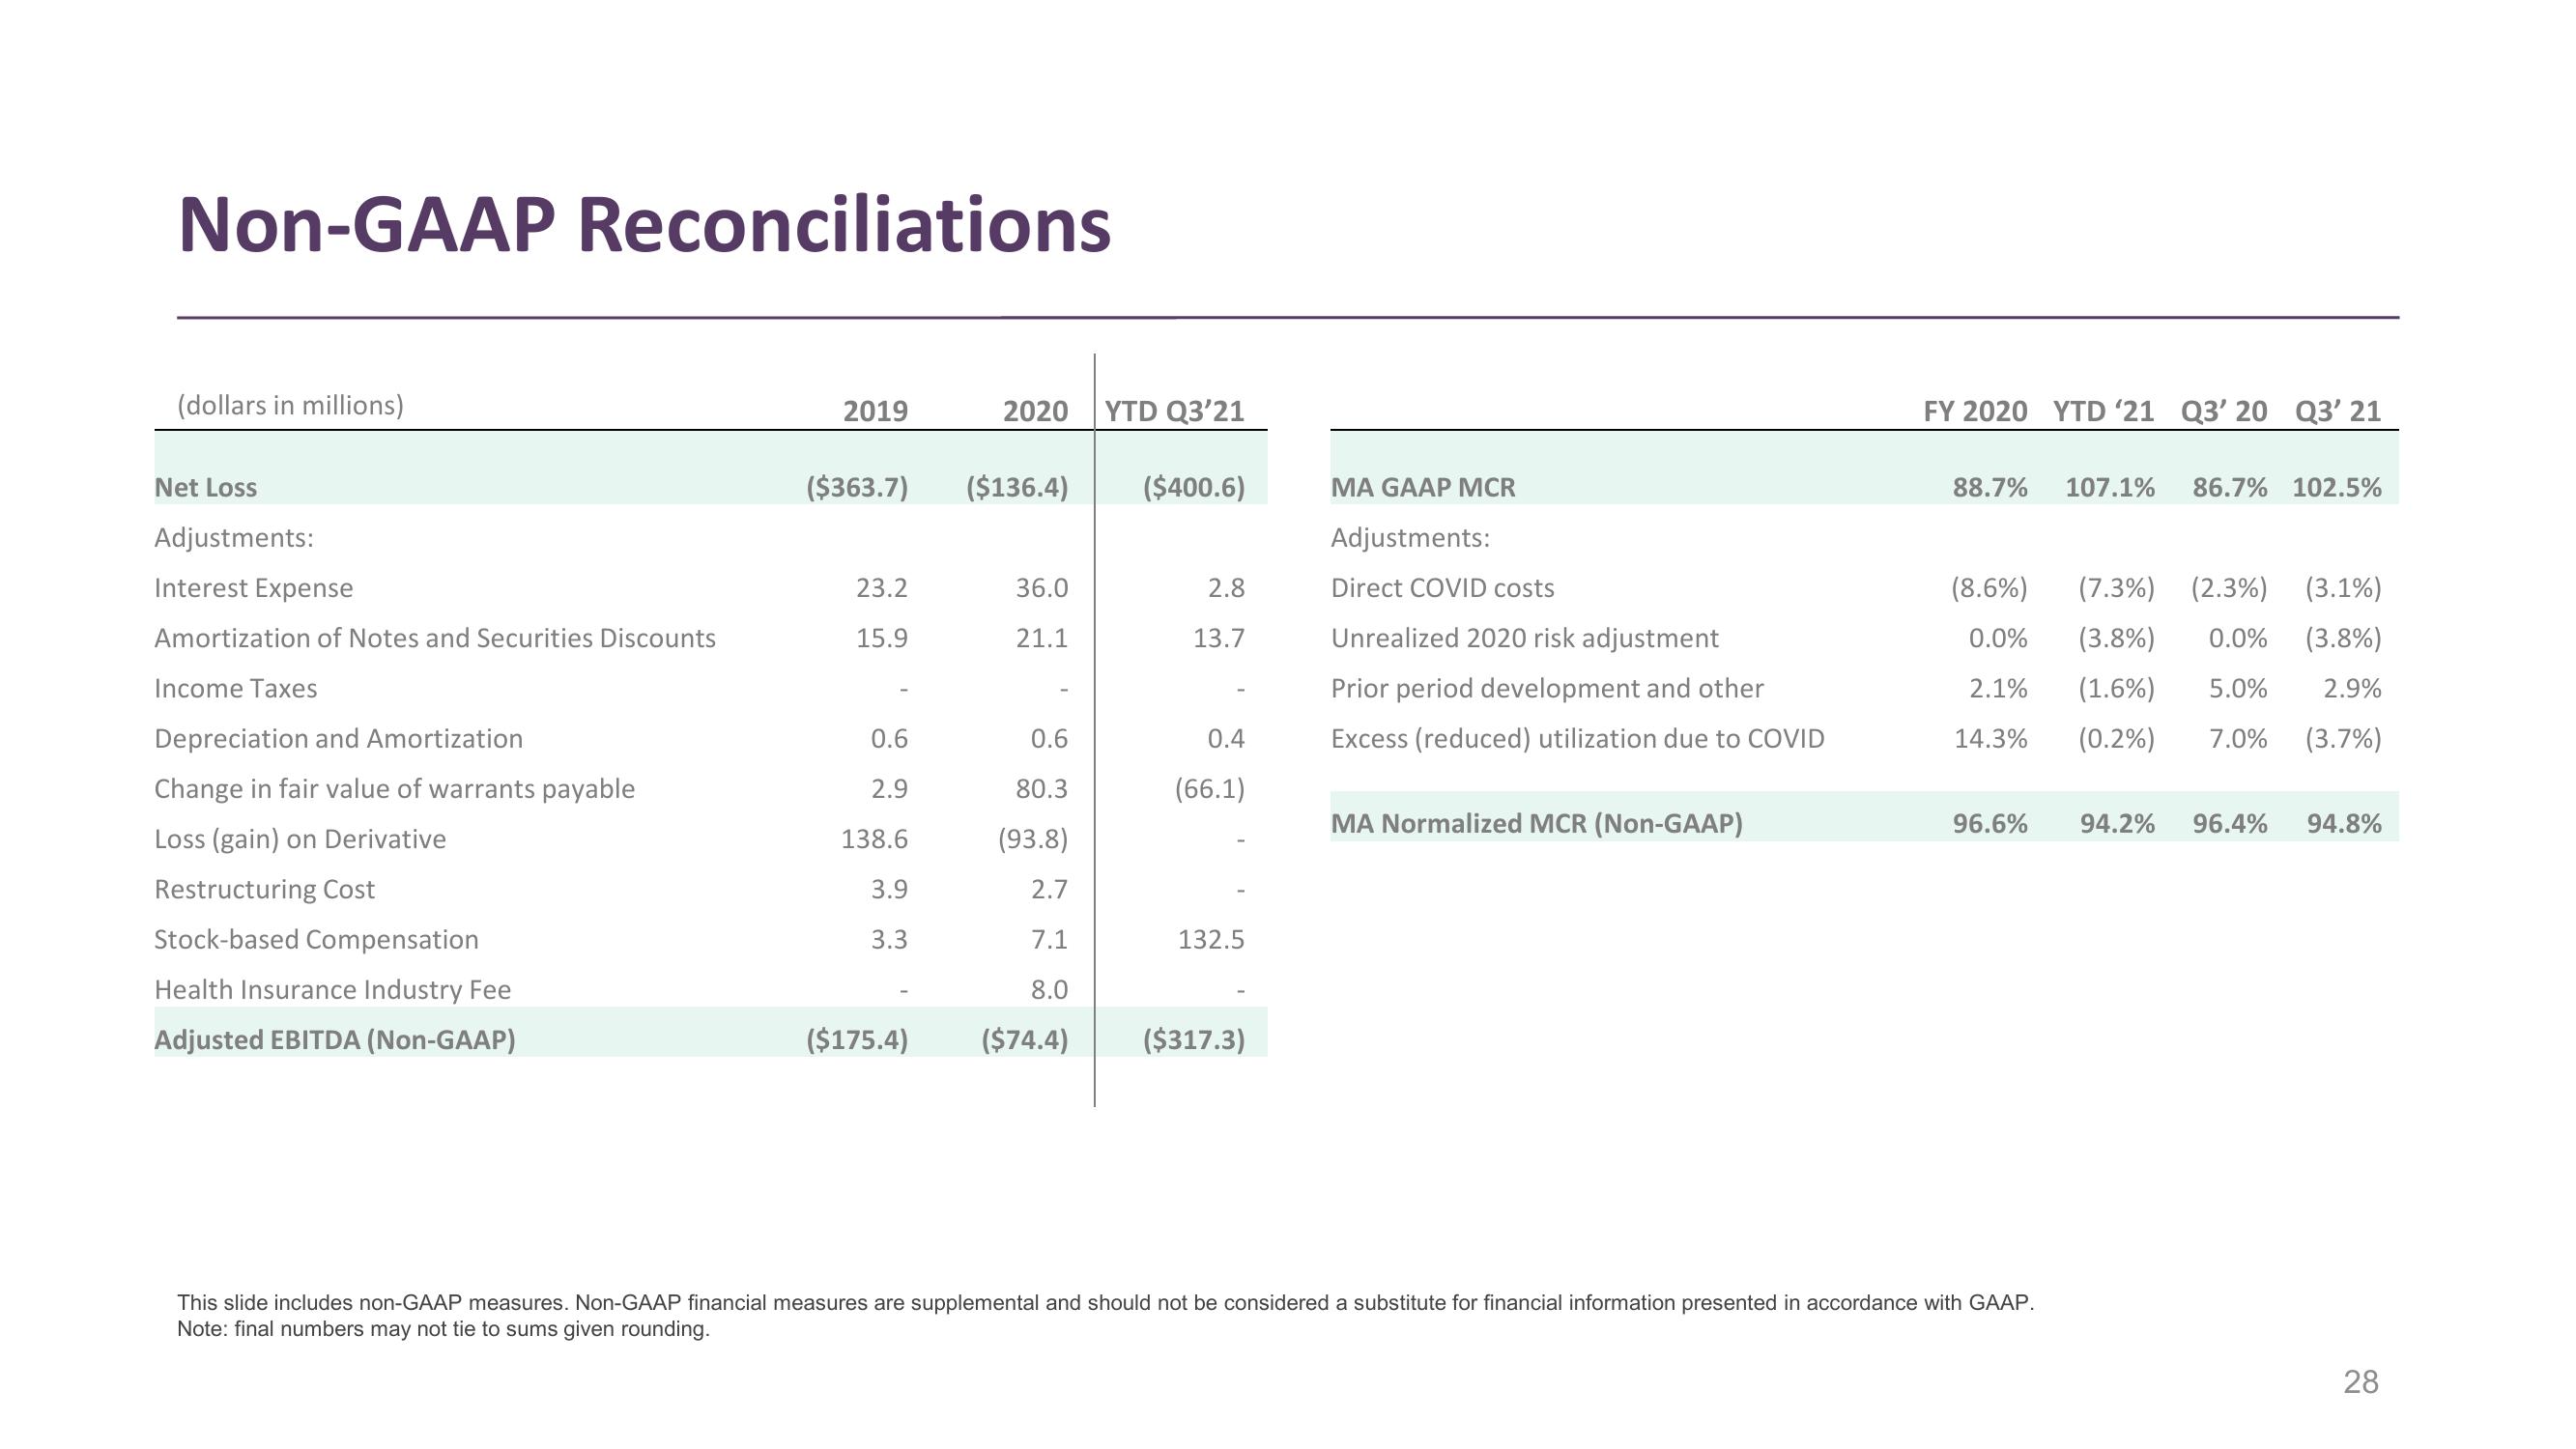
Non-GAAP Reconciliations
(dollars in millions)
Net Loss
Adjustments:
Interest Expense
Amortization of Notes and Securities Discounts
Income Taxes
Depreciation and Amortization
Change in fair value of warrants payable
Loss (gain) on Derivative
Restructuring Cost
Stock-based Compensation
Health Insurance Industry Fee
Adjusted EBITDA (Non-GAAP)
2019
($363.7)
23.2
15.9
0.6
2.9
138.6
3.9
3.3
2020
($136.4) ($400.6)
36.0
21.1
YTD Q3'21
0.6
80.3
(93.8)
2.7
7.1
8.0
($175.4) ($74.4)
2.8
13.7
0.4
(66.1)
132.5
($317.3)
MA GAAP MCR
Adjustments:
Direct COVID costs
Unrealized 2020 risk adjustment
Prior period development and other
Excess (reduced) utilization due to COVID
MA Normalized MCR (Non-GAAP)
FY 2020 YTD '21 Q3' 20 Q3' 21
88.7% 107.1%
(8.6%)
(7.3%) (2.3%) (3.1%)
0.0% (3.8%) 0.0% (3.8%)
(1.6%) 5.0% 2.9%
2.1%
14.3%
(0.2%) 7.0% (3.7%)
96.6%
86.7% 102.5%
This slide includes non-GAAP measures. Non-GAAP financial measures are supplemental and should not be considered a substitute for financial information presented in accordance with GAAP.
Note: final numbers may not tie to sums given rounding.
94.2% 96.4% 94.8%
28View entire presentation