Better Results Presentation Deck
Q3 2023
Financial Review
Key Highlights
Mortgage macro environment remains challenging with 30-year fixed
mortgage rates around 8%. As a result, we continue to throttle marketing
expenses to prioritize profitability over near-term growth
●
●
●
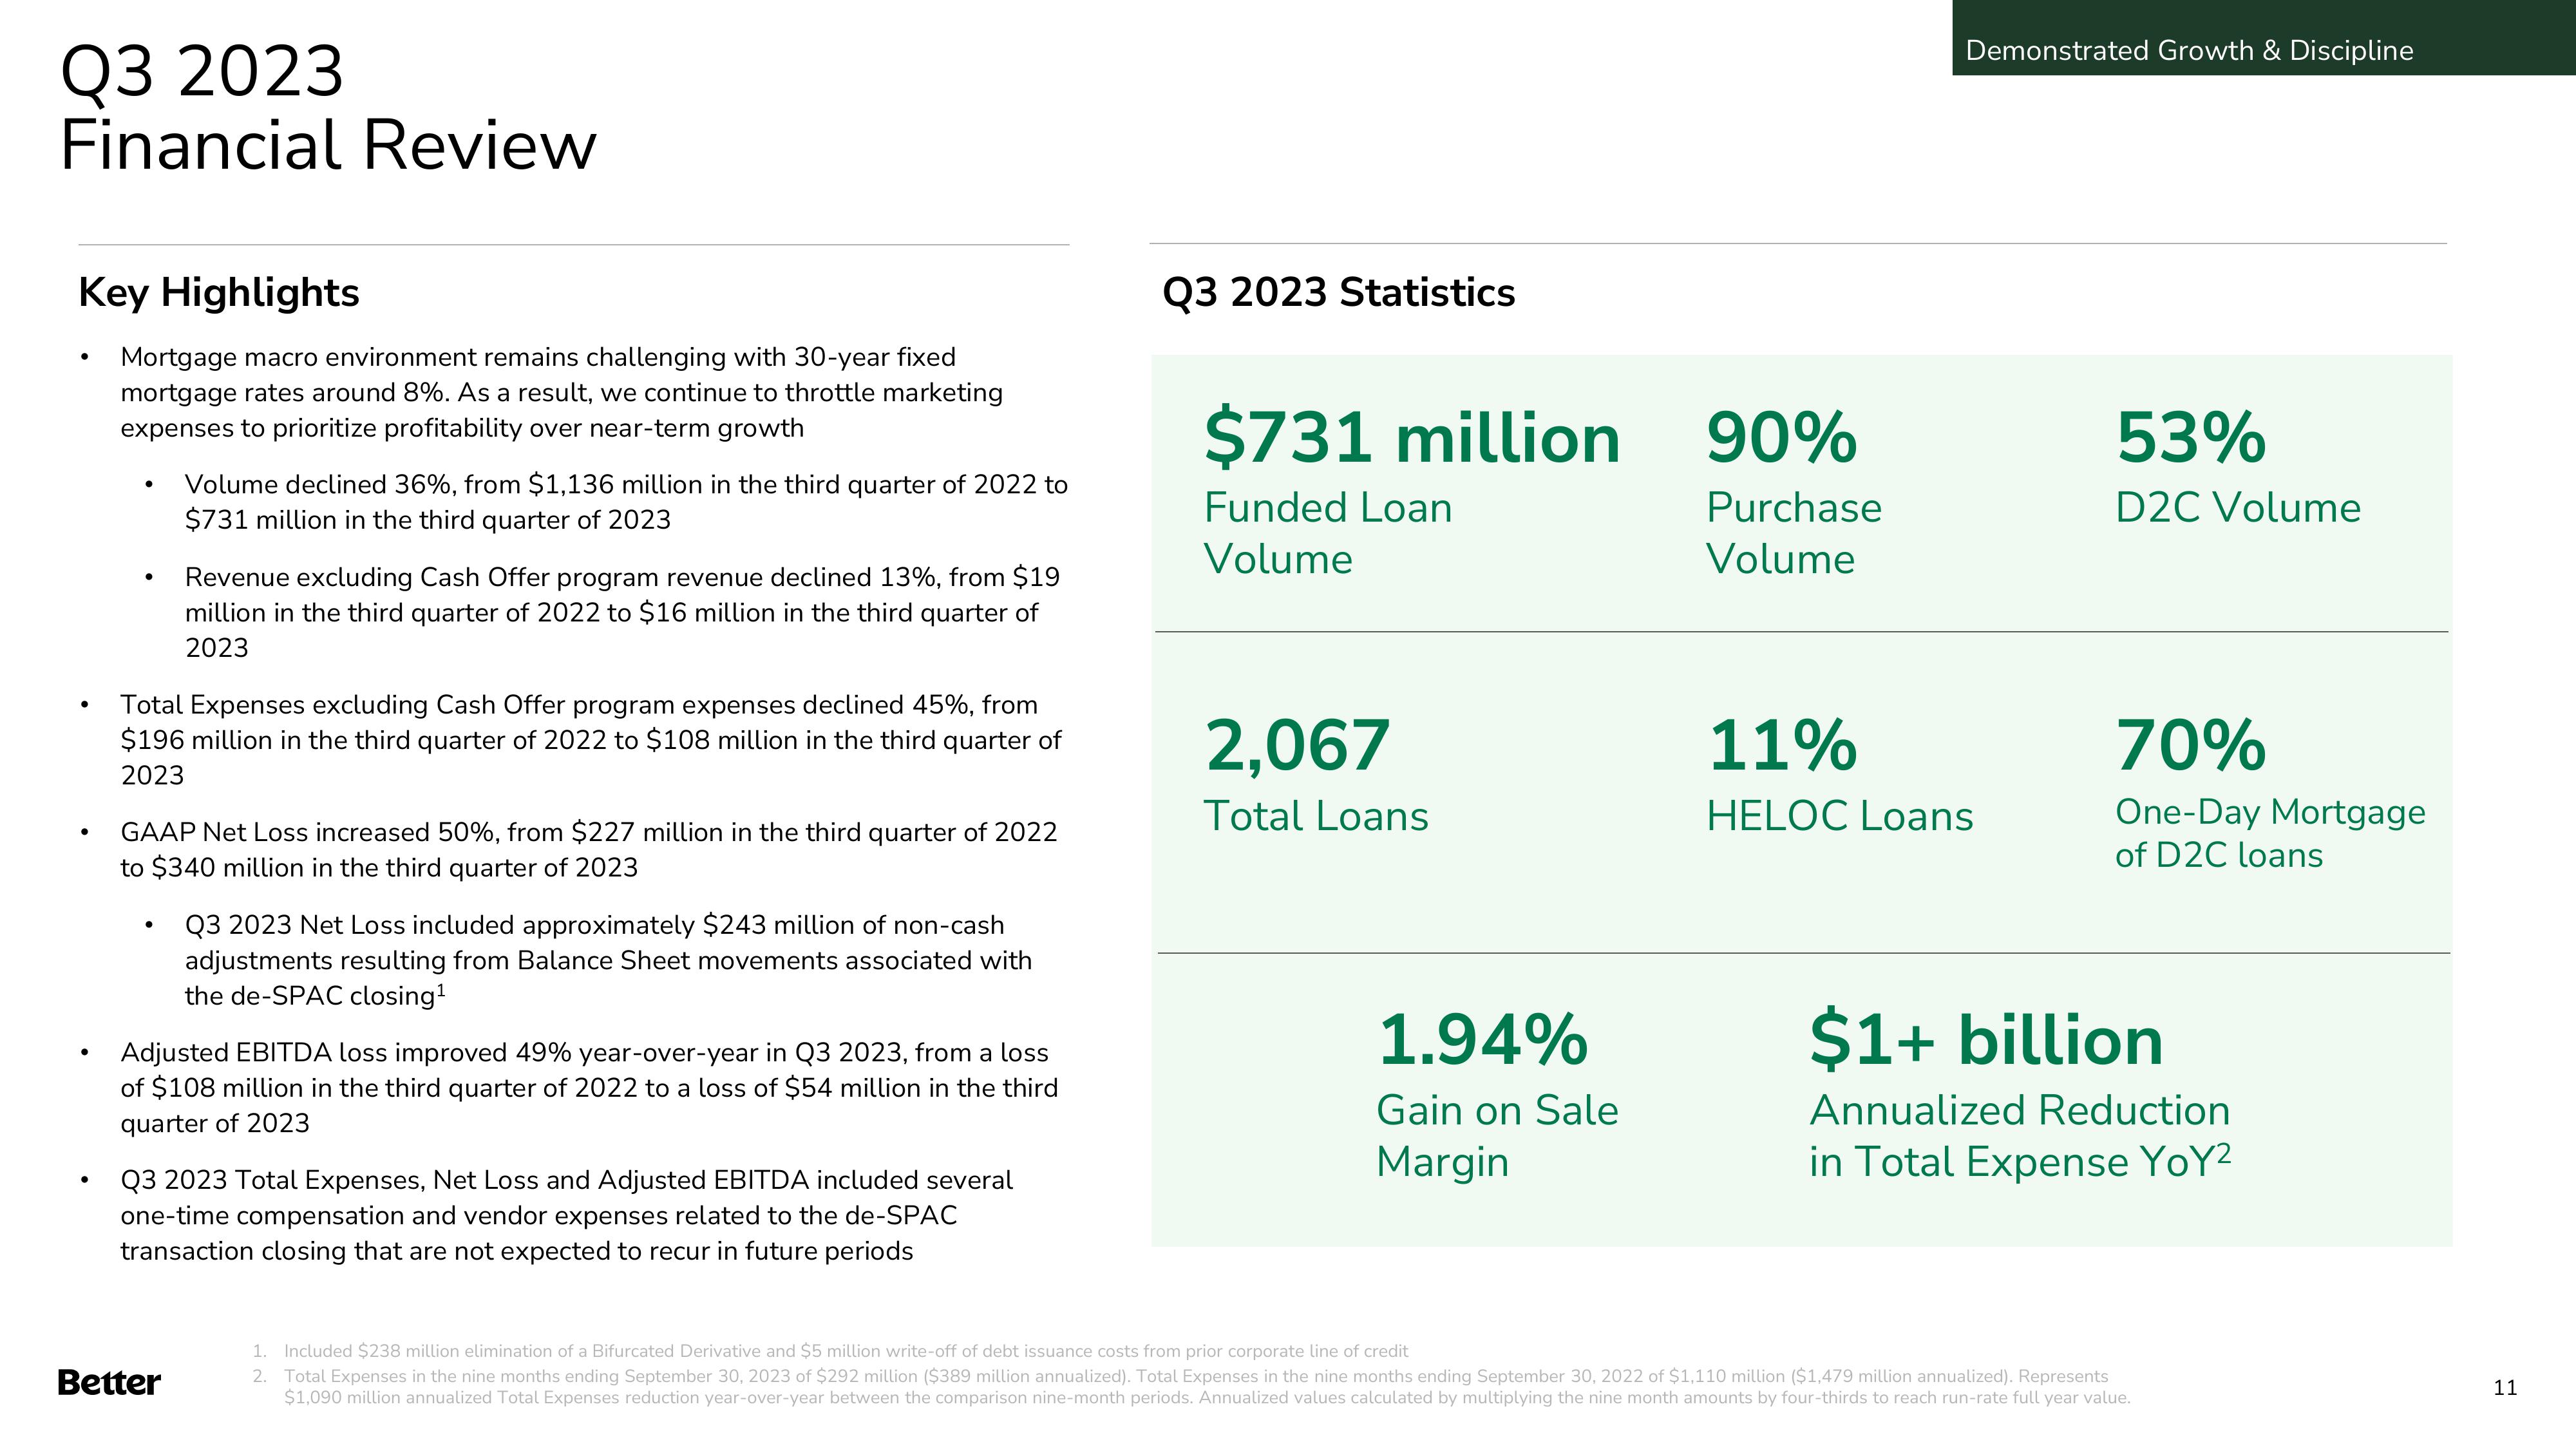
Volume declined 36%, from $1,136 million in the third quarter of 2022 to
$731 million in the third quarter of 2023
Total Expenses excluding Cash Offer program expenses declined 45%, from
$196 million in the third quarter of 2022 to $108 million in the third quarter of
2023
●
Revenue excluding Cash Offer program revenue declined 13%, from $19
million in the third quarter of 2022 to $16 million in the third quarter of
2023
GAAP Net Loss increased 50%, from $227 million in the third quarter of 2022
to $340 million in the third quarter of 2023
Better
Q3 2023 Net Loss included approximately $243 million of non-cash
adjustments resulting from Balance Sheet movements associated with
the de-SPAC closing¹
Adjusted EBITDA loss improved 49% year-over-year in Q3 2023, from a loss
of $108 million in the third quarter of 2022 to a loss of $54 million in the third
quarter of 2023
Q3 2023 Total Expenses, Net Loss and Adjusted EBITDA included several
one-time compensation and vendor expenses related to the de-SPAC
transaction closing that are not expected to recur in future periods
Q3 2023 Statistics
$731 million
Funded Loan
Volume
2,067
Total Loans
1.94%
Gain on Sale
Margin
90%
Purchase
Volume
Demonstrated Growth & Discipline
11%
HELOC Loans
53%
D2C Volume
70%
One-Day Mortgage
of D2C loans
$1+ billion
Annualized Reduction
in Total Expense YoY²
1. Included $238 million elimination of a Bifurcated Derivative and $5 million write-off of debt issuance costs from prior corporate line of credit
2. Total Expenses in the nine months ending September 30, 2023 of $292 million ($389 million annualized). Total Expenses in the nine months ending September 30, 2022 of $1,110 million ($1,479 million annualized). Represents
$1,090 million annualized Total Expenses reduction year-over-year between the comparison nine-month periods. Annualized values calculated by multiplying the nine month amounts by four-thirds to reach run-rate full year value.
11View entire presentation