Getaround SPAC Presentation Deck
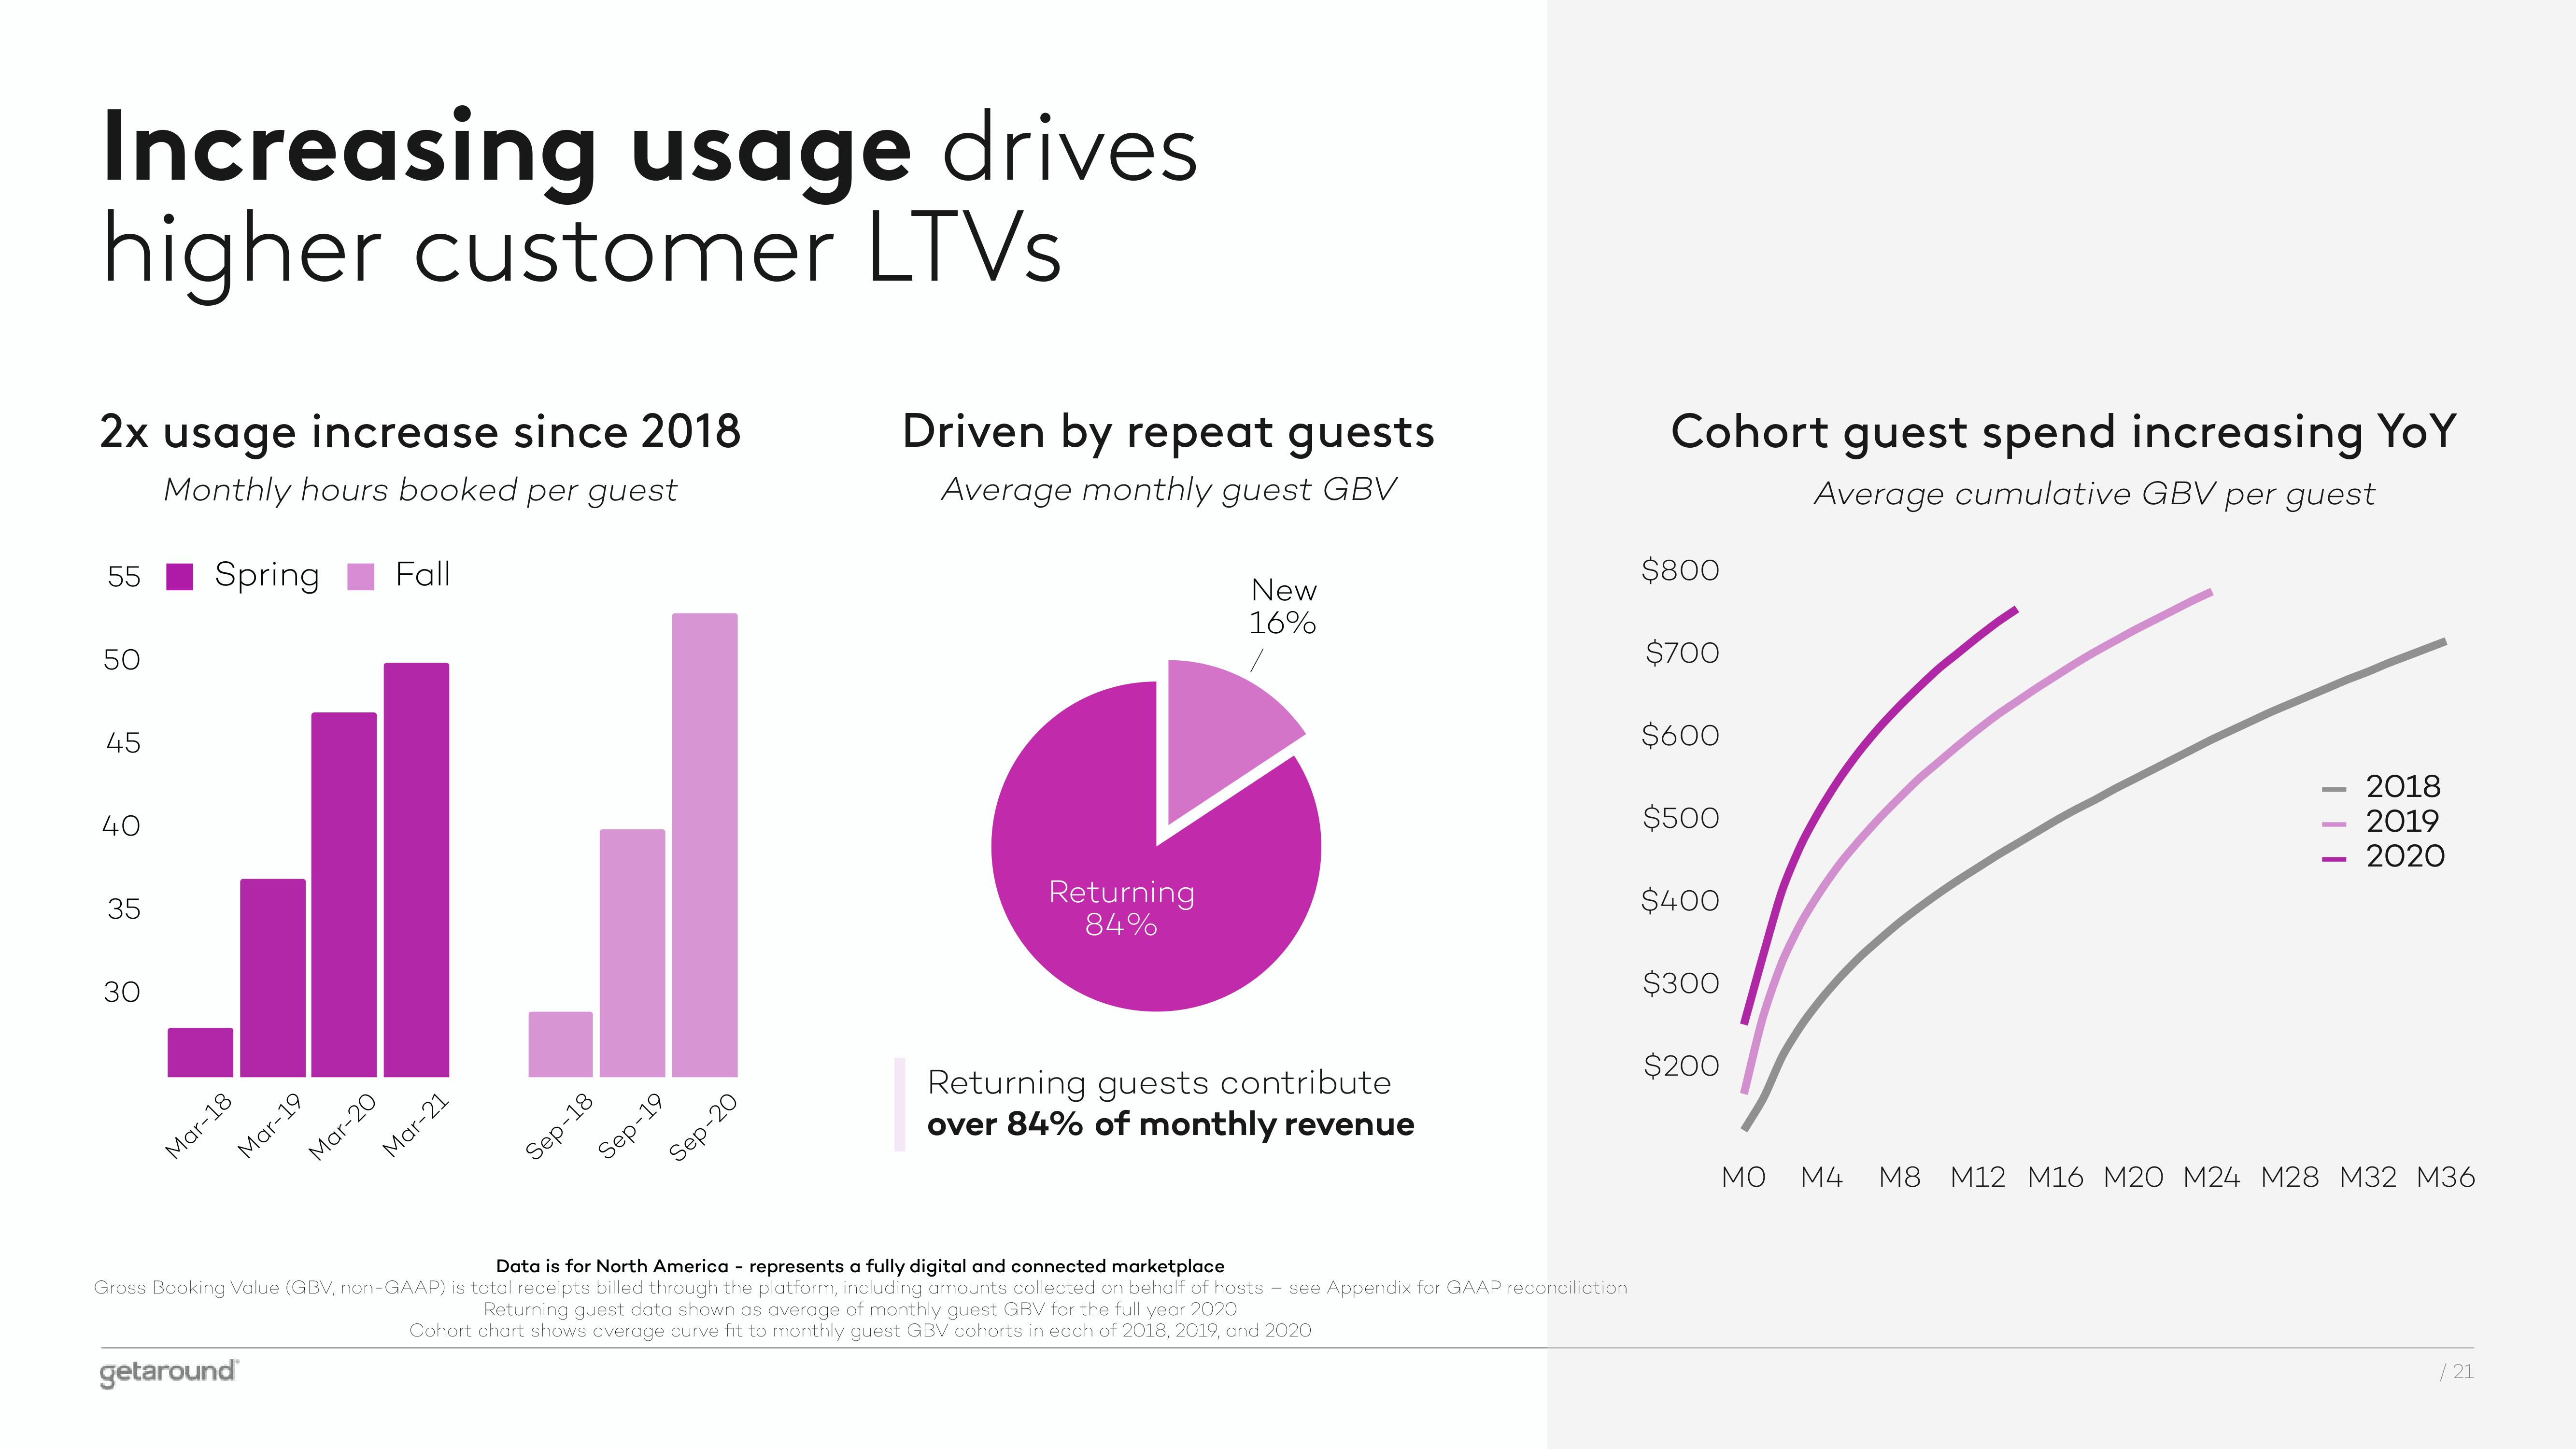
Increasing usage drives
higher customer LTVs
2x usage increase since 2018
Monthly hours booked per guest
Spring Fall
55
50
45
40
35
30
Mar-18
Mar-19
Mar-21
getaround
Mar-20
Sep-18
Sep-19
Sep-20
Driven by repeat guests
Average monthly guest GBV
Returning
84%
New
16%
Returning guests contribute
over 84% of monthly revenue
Data is for North America - represents a fully digital and connected marketplace
Gross Booking Value (GBV, non-GAAP) is total receipts billed through the platform, including amounts collected on behalf of hosts - see Appendix for GAAP reconciliation
Returning guest data shown as average of monthly guest GBV for the full year 2020
Cohort chart shows average curve fit to monthly guest GBV cohorts in each of 2018, 2019, and 2020
Cohort guest spend increasing YoY
Average cumulative GBV per guest
$800
$700
$600
$500
$400
$300
$200
ΜΟ M4
M8
|||
2018
2019
2020
M12 M16 M20 M24 M28 M32 M36
/21View entire presentation