Main Street Capital Fixed Income Presentation Deck
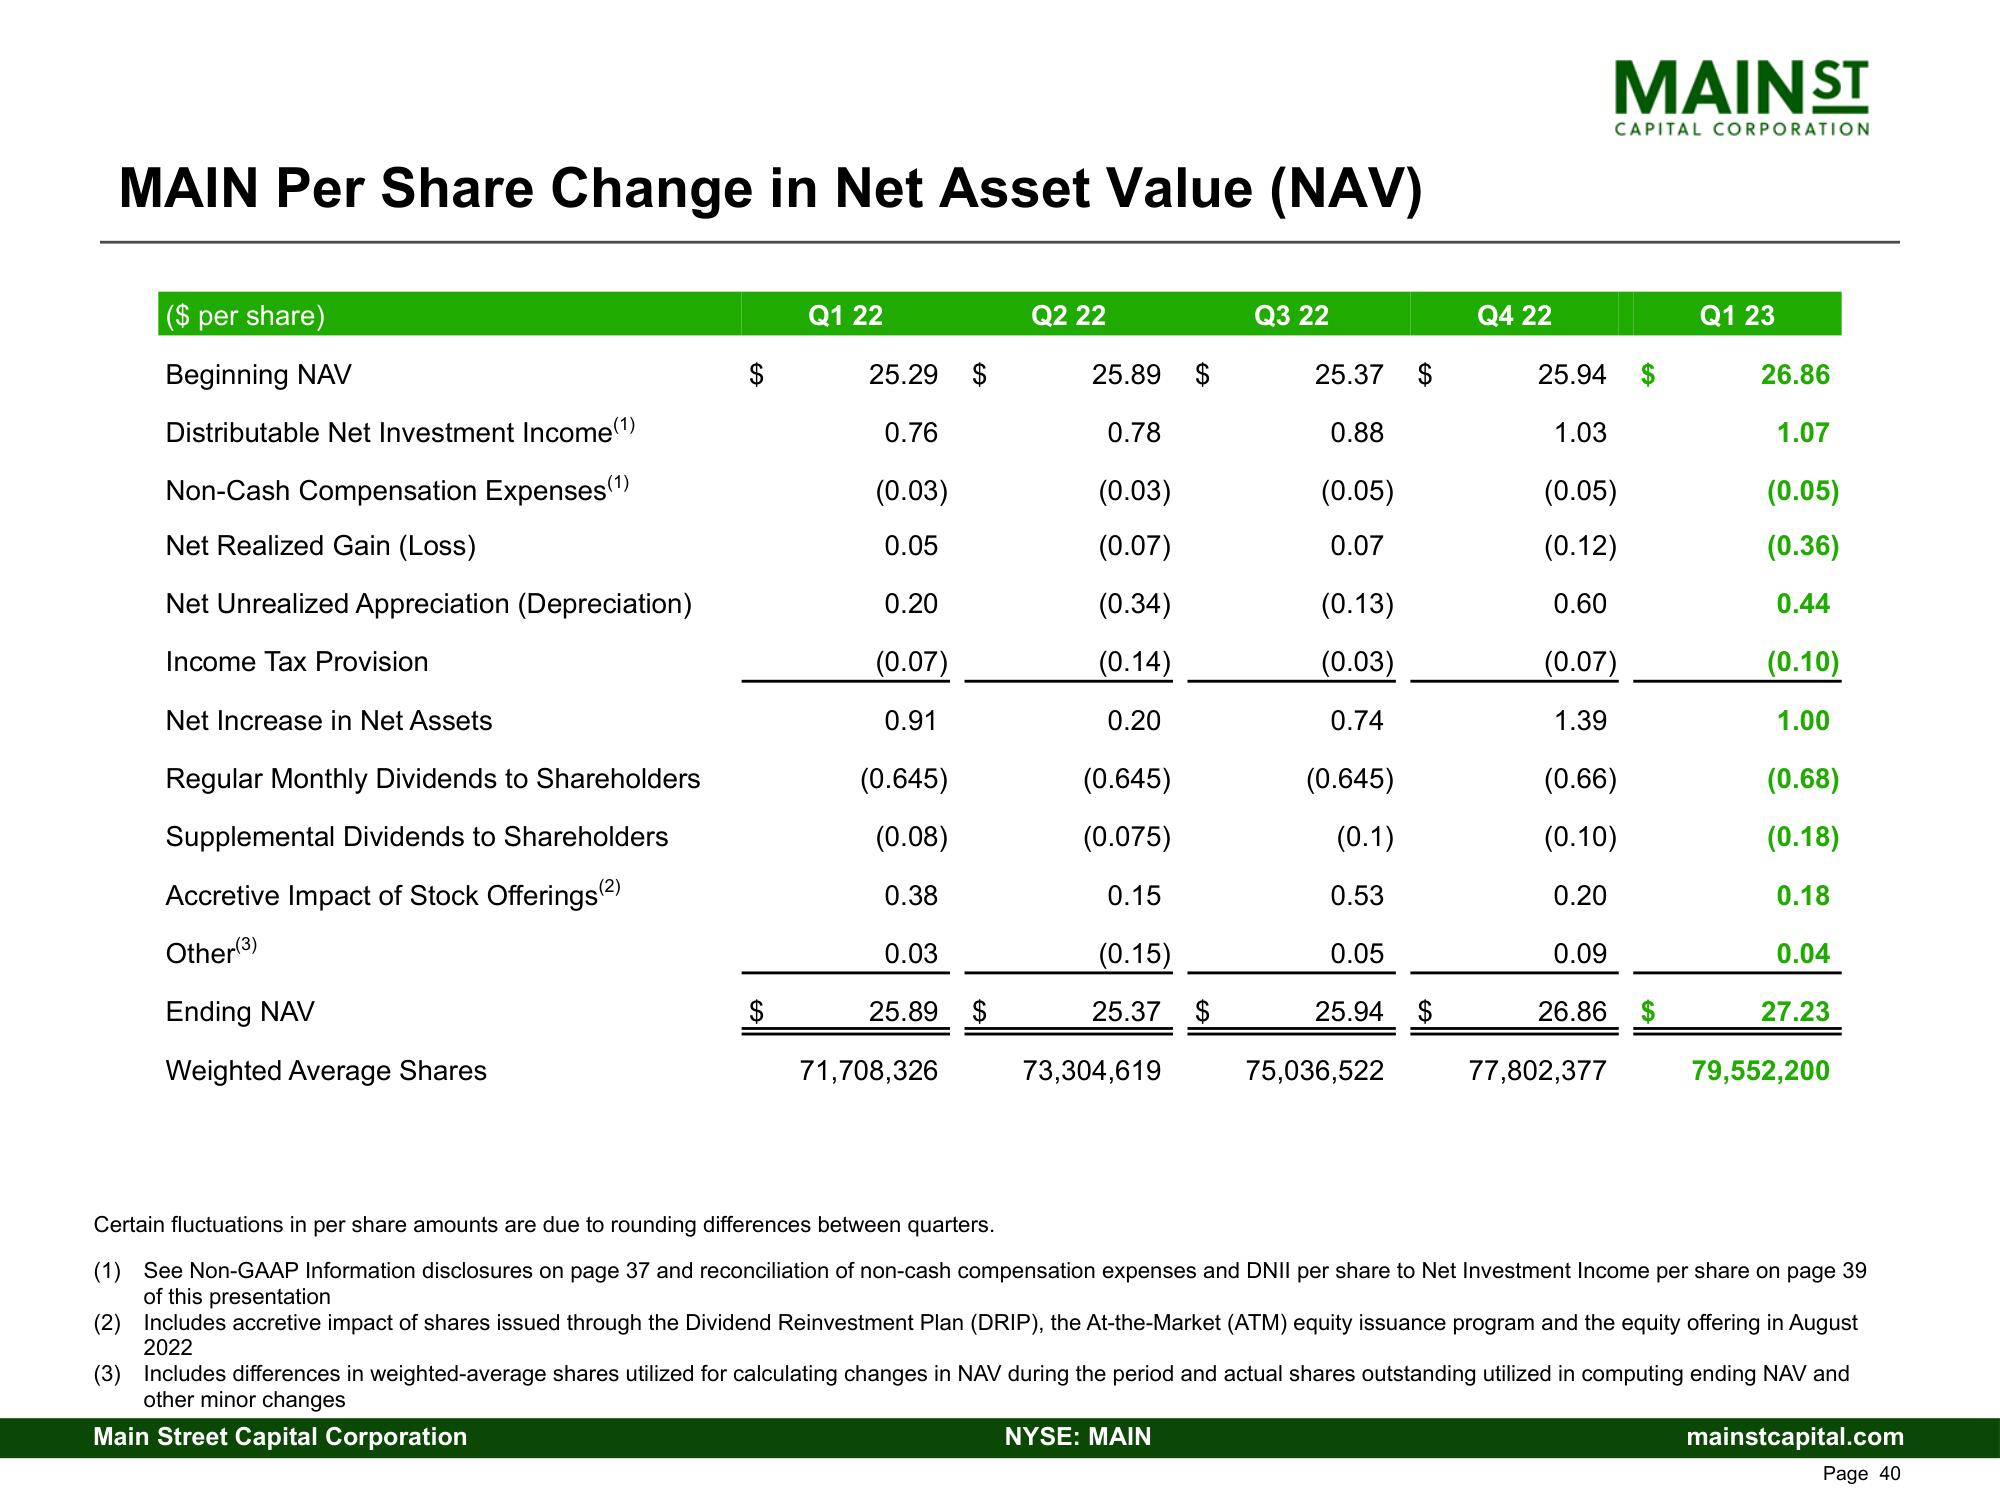
MAIN Per Share Change in Net Asset Value (NAV)
($ per share)
Beginning NAV
Distributable Net Investment Income(¹)
Non-Cash Compensation Expenses (1)
Net Realized Gain (Loss)
Net Unrealized Appreciation (Depreciation)
Income Tax Provision
Net Increase in Net Assets
Regular Monthly Dividends to Shareholders
Supplemental Dividends to Shareholders
Accretive Impact of Stock Offerings (²)
Other(3)
Ending NAV
Weighted Average Shares
$
Q1 22
25.29
0.76
(0.03)
0.05
0.20
$
(0.07)
0.91
(0.645)
(0.08)
0.38
0.03
25.89 $
71,708,326
Q2 22
25.89
0.78
(0.03)
(0.07)
(0.34)
(0.14)
0.20
(0.645)
(0.075)
0.15
(0.15)
25.37 $
73,304,619
$
Q3 22
NYSE: MAIN
25.37
0.88
(0.05)
0.07
(0.13)
(0.03)
0.74
(0.645)
(0.1)
0.53
0.05
$
25.94 $
75,036,522
Q4 22
MAIN ST
77,802,377
CAPITAL CORPORATION
25.94
1.03
(0.05)
(0.12)
0.60
(0.07)
1.39
(0.66)
(0.10)
0.20
0.09
26.86
$
Q1 23
26.86
1.07
(0.05)
(0.36)
0.44
(0.10)
1.00
(0.68)
(0.18)
0.18
0.04
27.23
79,552,200
Certain fluctuations in per share amounts are due to rounding differences between quarters.
(1) See Non-GAAP Information disclosures on page 37 and reconciliation of non-cash compensation expenses and DNII per share to Net Investment Income per share on page 39
of this presentation
(2) Includes accretive impact of shares issued through the Dividend Reinvestment Plan (DRIP), the At-the-Market (ATM) equity issuance program and the equity offering in August
2022
(3) Includes differences in weighted-average shares utilized for calculating changes in NAV during the period and actual shares outstanding utilized in computing ending NAV and
other minor changes
Main Street Capital Corporation
mainstcapital.com
Page 40View entire presentation