LiveVox Results Presentation Deck
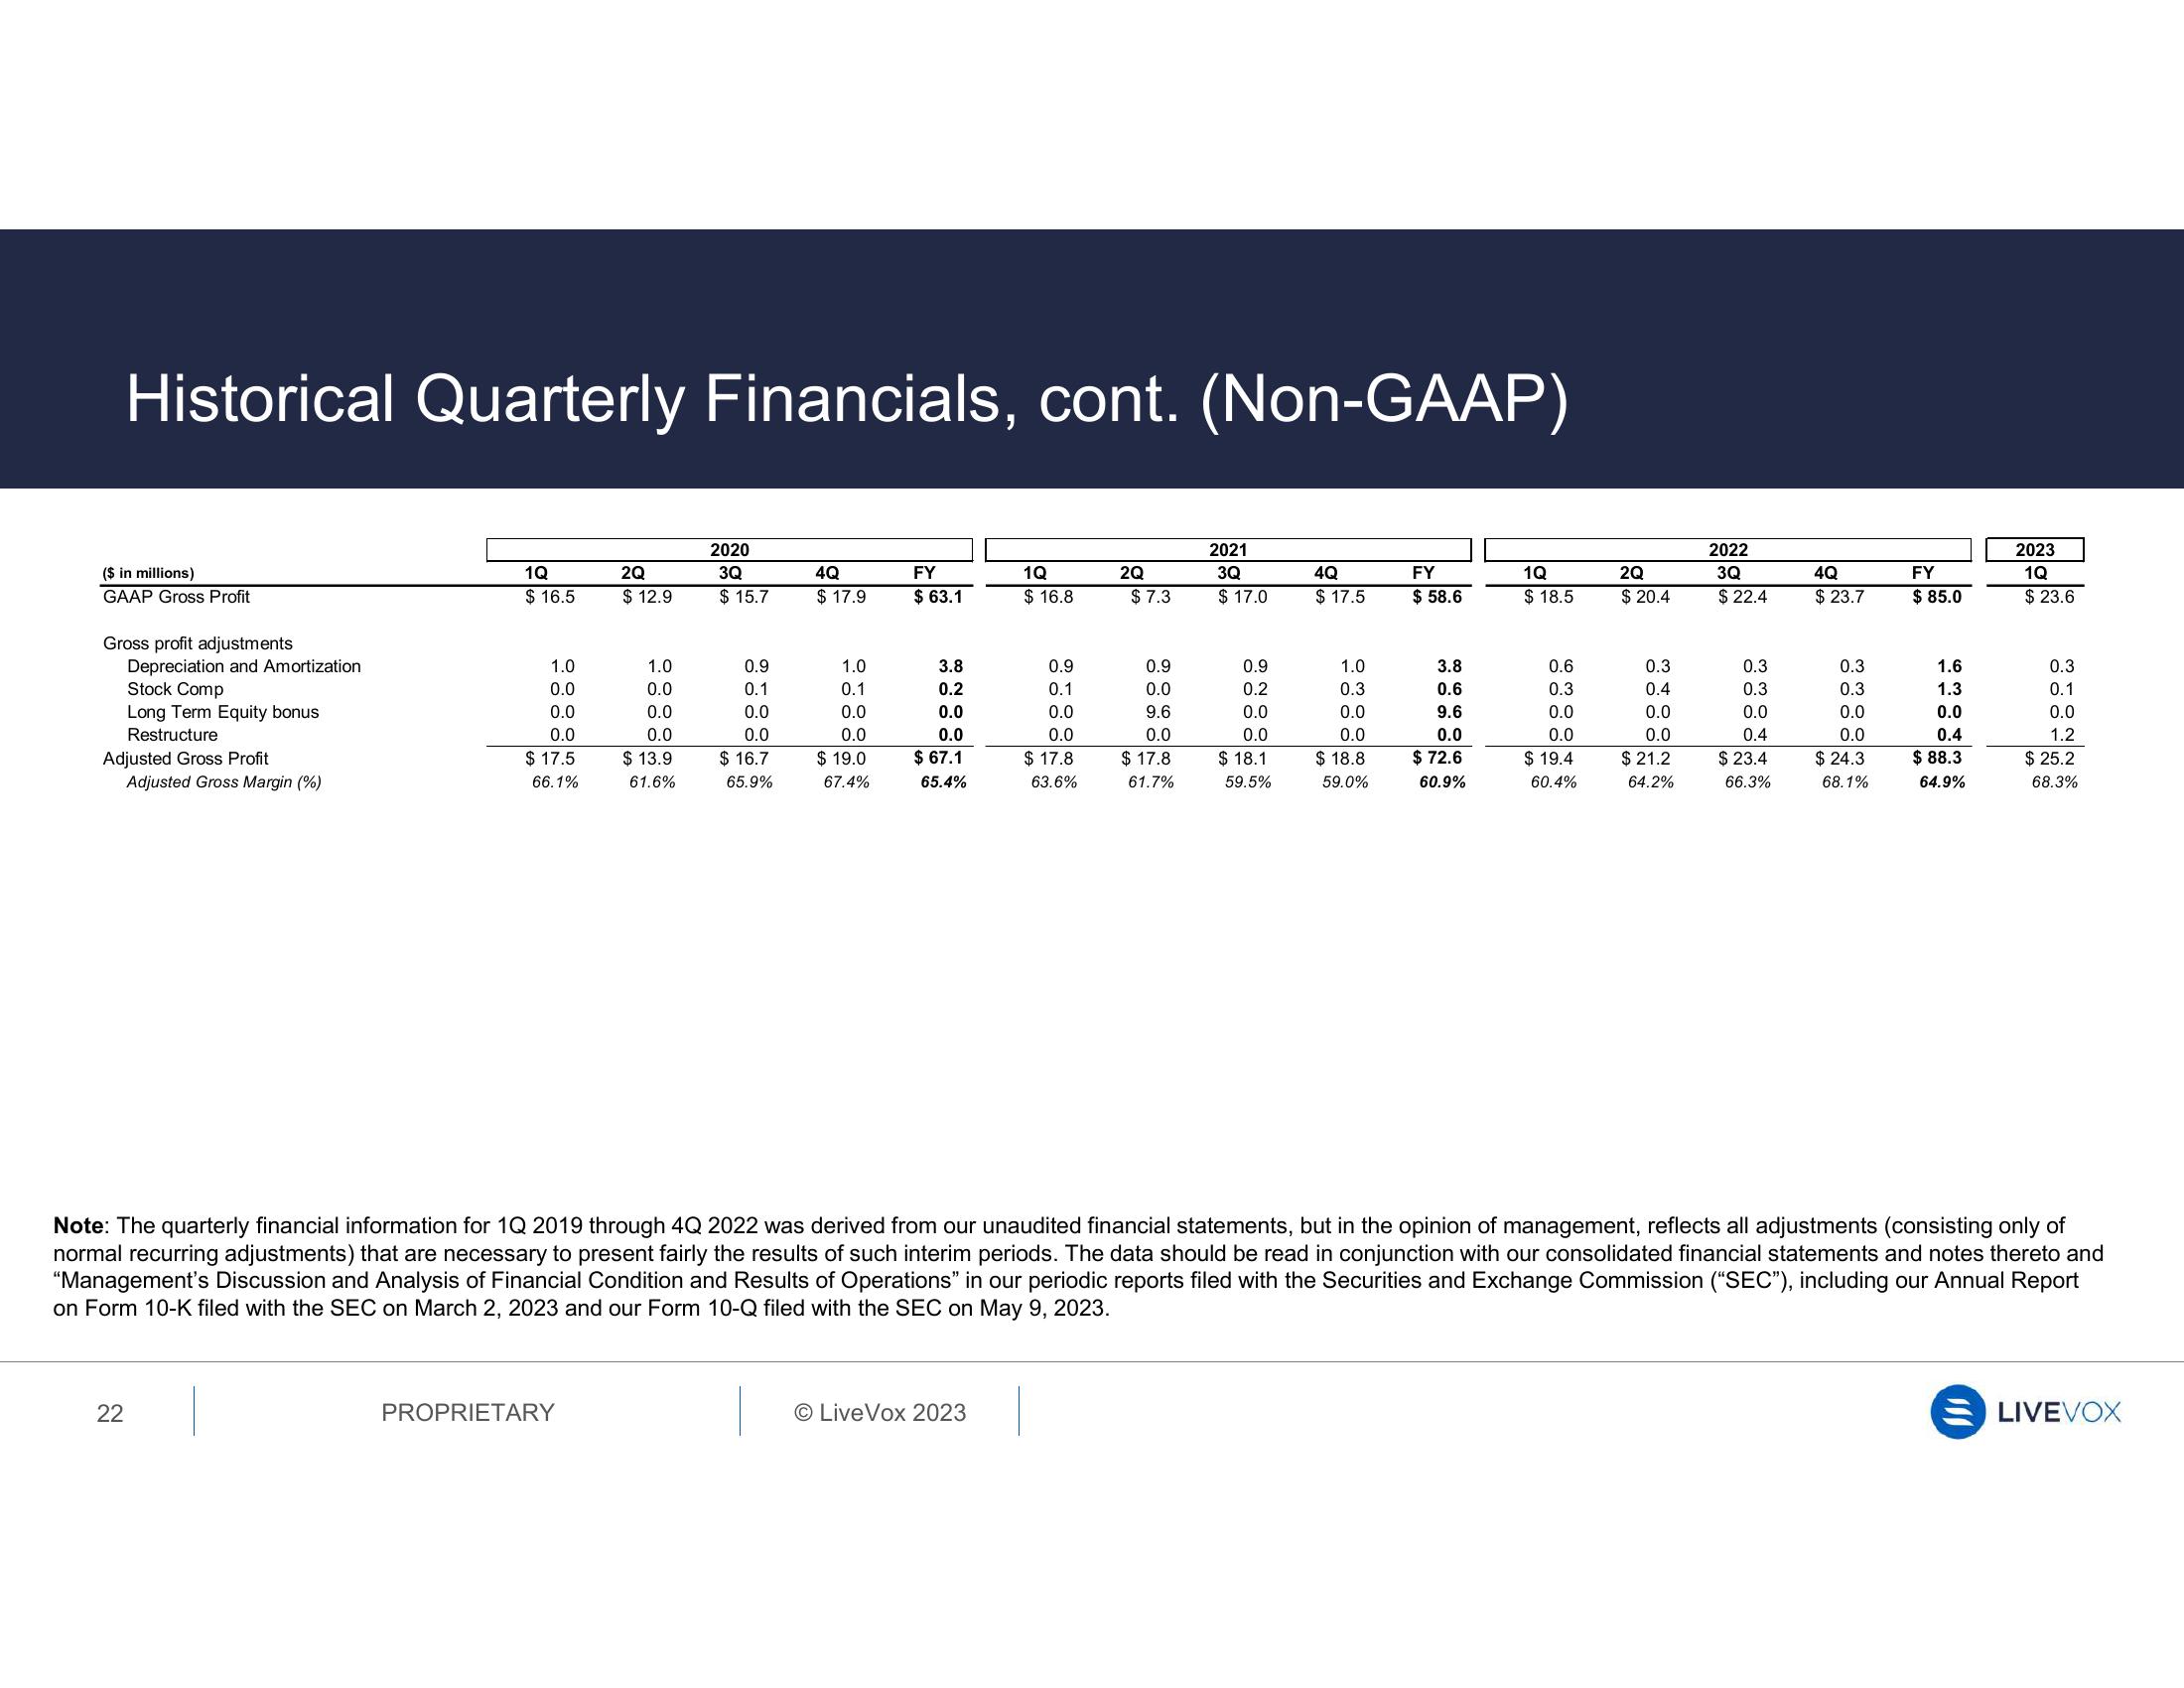
Historical Quarterly Financials, cont. (Non-GAAP)
($ in millions)
GAAP Gross Profit
Gross profit adjustments
Depreciation and Amortization
Stock Comp
Long Term Equity bonus
Restructure
Adjusted Gross Profit
Adjusted Gross Margin (%)
22
1Q
$16.5
1.0
0.0
0.0
0.0
$17.5
66.1%
2Q
$ 12.9
PROPRIETARY
1.0
0.0
0.0
0.0
$13.9
61.6%
2020
3Q
$15.7
0.9
0.1
0.0
0.0
$16.7
65.9%
4Q
$17.9
1.0
0.1
0.0
0.0
$19.0
67.4%
FY
$63.1
3.8
0.2
0.0
0.0
$ 67.1
65.4%
1Q
$16.8
O LiveVox 2023
0.9
0.1
0.0
0.0
$17.8
63.6%
2Q
$7.3
0.9
0.0
9.6
0.0
$17.8
61.7%
2021
3Q
$ 17.0
0.9
0.2
0.0
0.0
$18.1
59.5%
4Q
$17.5
1.0
0.3
0.0
0.0
$18.8
59.0%
FY
$ 58.6
3.8
0.6
9.6
0.0
$72.6
60.9%
1Q
$ 18.5
0.6
0.3
0.0
0.0
$19.4
60.4%
2Q
$20.4
34000
0.3
0.4
0.0
0.0
$21.2
64.2%
2022
3Q
$22.4
0.3
0.3
0.0
0.4
$ 23.4
66.3%
4Q
$23.7
0.3
0.3
0.0
0.0
$24.3
68.1%
FY
$85.0
1.6
1.3
0.0
0.4
$ 88.3
64.9%
Note: The quarterly financial information for 1Q 2019 through 4Q 2022 was derived from our unaudited financial statements, but in the opinion of management, reflects all adjustments (consisting only of
normal recurring adjustments) that are necessary to present fairly the results of such interim periods. The data should be read in conjunction with our consolidated financial statements and notes thereto and
"Management's Discussion and Analysis of Financial Condition and Results of Operations" in our periodic reports filed with the Securities and Exchange Commission ("SEC"), including our Annual Report
on Form 10-K filed with the SEC on March 2, 2023 and our Form 10-Q filed with the SEC on May 9, 2023.
2023
1Q
$23.6
0.3
0.1
0.0
1.2
$ 25.2
68.3%
LIVEVOXView entire presentation