Allego SPAC Presentation Deck
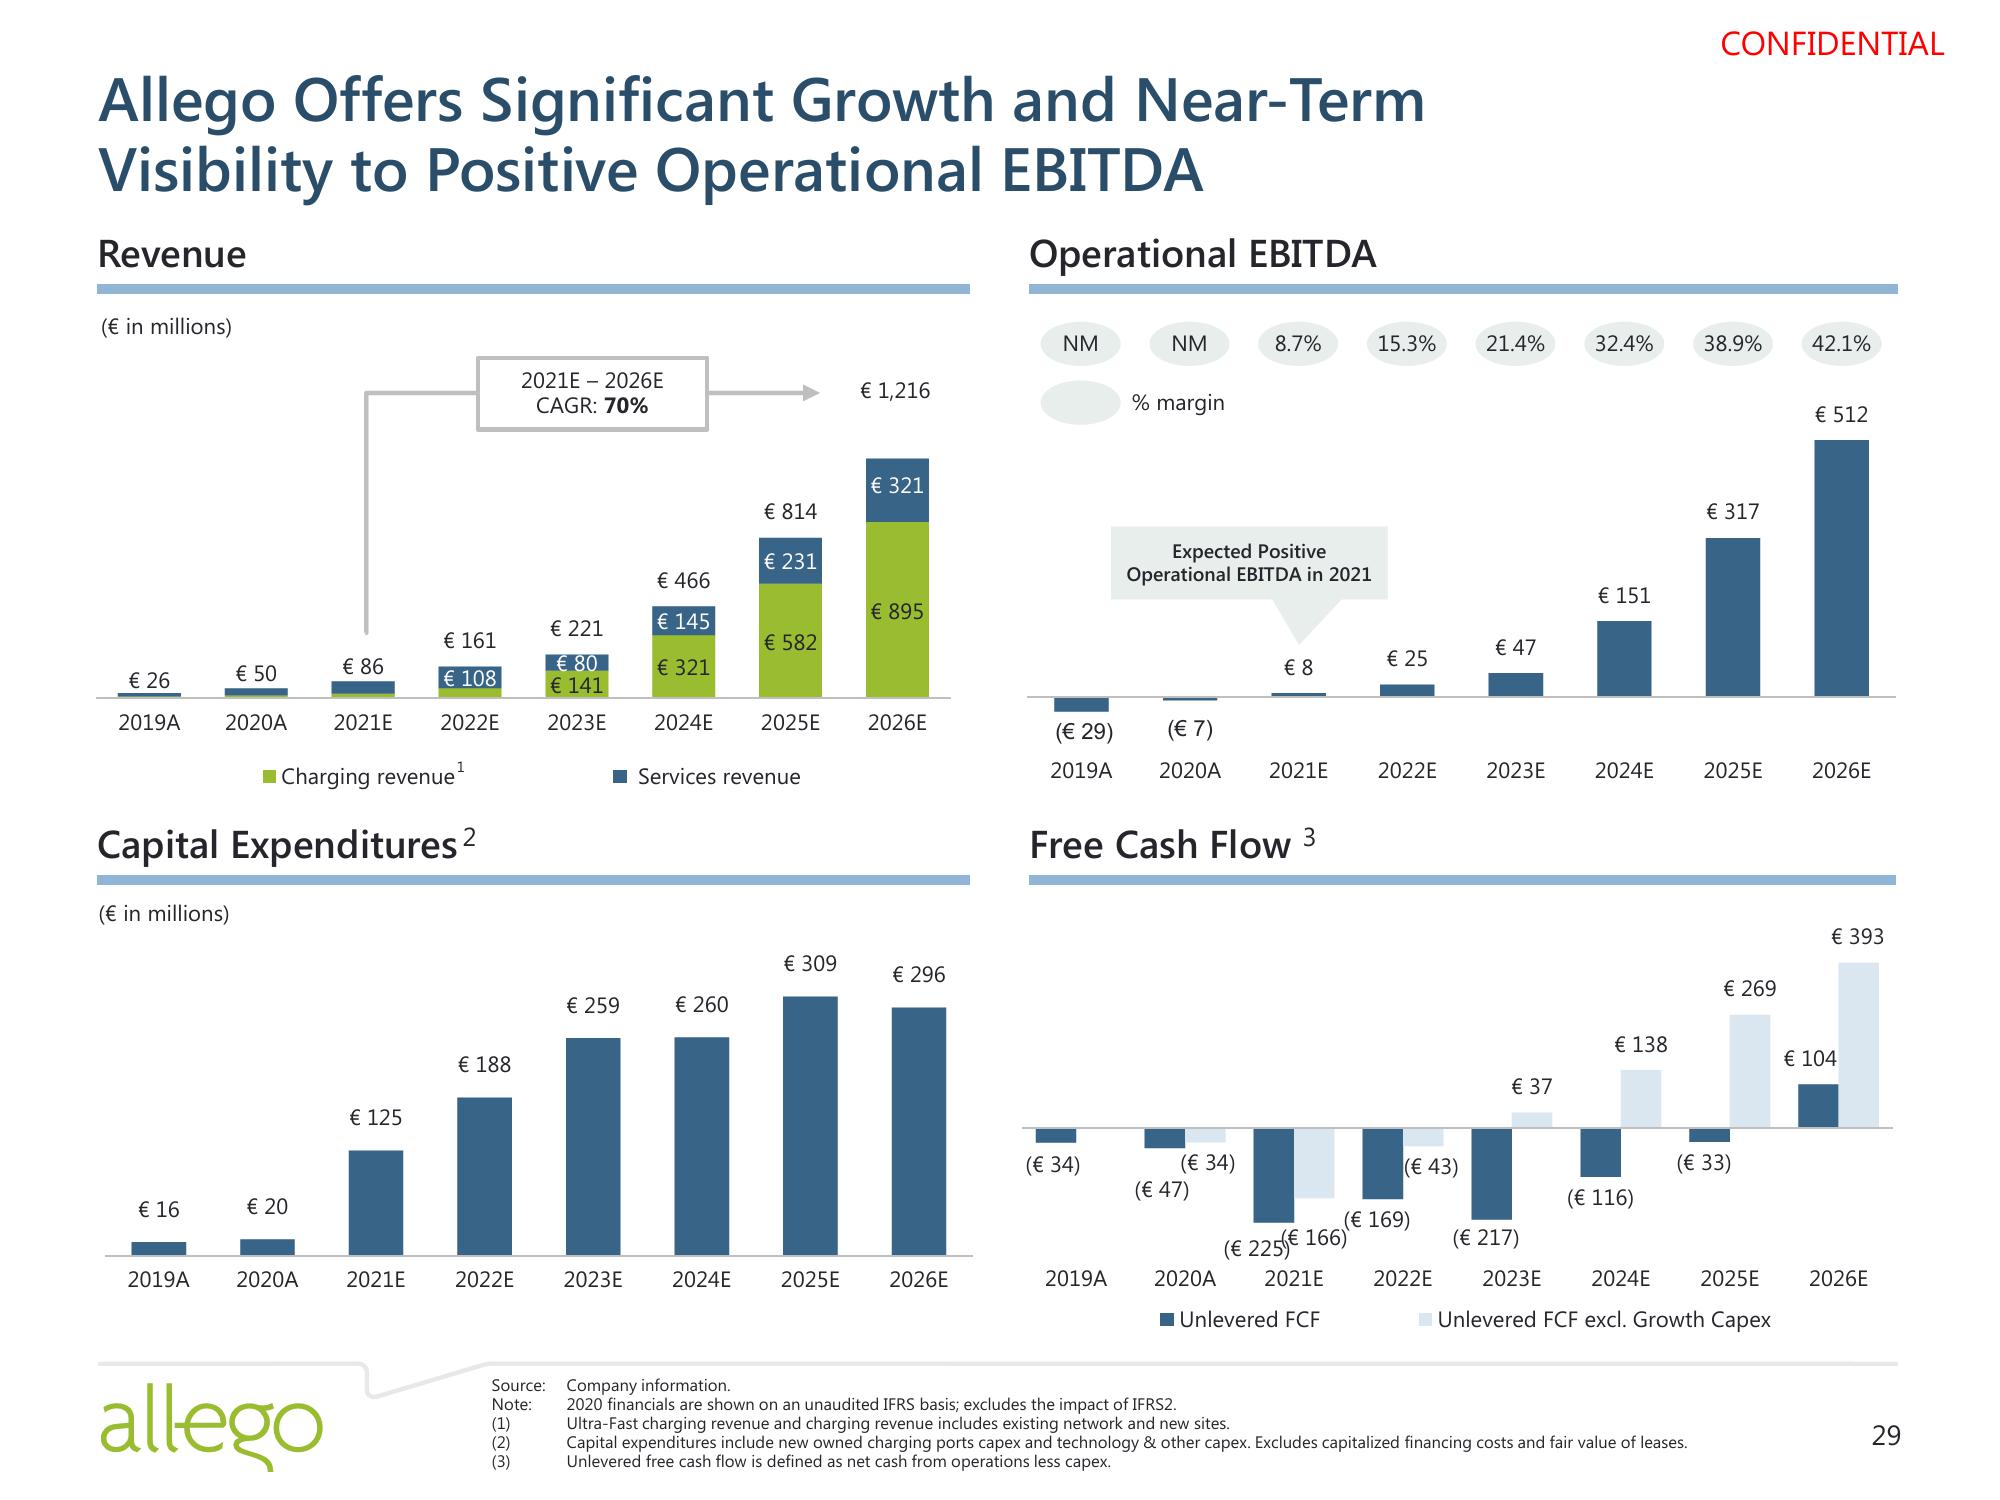
Allego Offers Significant Growth and Near-Term
Visibility to Positive Operational EBITDA
Revenue
Operational EBITDA
(€ in millions)
€ 26
2019A
(€ in millions)
€ 16
€ 50
2020A
2019A
1
Charging revenue ¹
Capital Expenditures ²
€ 20
2020A
€ 86
allego
2021E
€ 125
€ 161
€ 108
2022E
2021E
€ 188
2022E
2021E2026E
CAGR: 70%
(1)
(2)
(3)
€ 221
€ 80
€ 141
2023E
€ 259
2023E
€ 466
€ 145
€ 321
2024E
€ 260
2024E
Source: Company information.
Note:
€ 814
€ 231
Services revenue
€ 582
2025E
€ 309
2025E
€ 1,216
€ 321
€ 895
2026E
€ 296
2026E
NM
(€ 34)
NM
2019A
% margin
Expected Positive
Operational EBITDA in 2021
(€ 29)
2019A
(€ 7)
2020A 2021E
Free Cash Flow 3
8.7%
(€ 34)
(€ 47)
2020A
€ 8
2021E
Unlevered FCF
(€225€ 166)
15.3%
€ 25
2022E
(€ 43)
(€ 169)
2022E
21.4%
€ 47
2023E
€ 37
32.4%
€ 151
2024E
€ 138
(€ 116)
CONFIDENTIAL
38.9%
2020 financials are shown on an unaudited IFRS basis; excludes the impact of IFRS2.
Ultra-Fast charging revenue and charging revenue includes existing network and new sites.
Capital expenditures include new owned charging ports capex and technology & other capex. Excludes capitalized financing costs and fair value of leases.
Unlevered free cash flow is defined as net cash from operations less capex.
€ 317
2025E
€ 269
(€ 33)
(€ 217)
2025E
2023E 2024E
Unlevered FCF excl. Growth Capex
42.1%
€ 512
2026E
€ 393
€ 104
2026E
29View entire presentation