Investor Presentation
1
3-SOLAR PV CAPEX
Solar PV CAPEX evolution and 2022 estimates
Tiers 1 Module capacities (GW)
EUR
Modules
Trackers
2020 Post Covid
Price W
2021
Cost per MW
Price W
0.193
193,000
0.25
Cost per MW
250,000
H2 2022
Price W Cost per MW
0.23
2020
2021
2022
230,000
Longi
24
45
Jinko
19
30
0.086
86,000
0.1
100,000
0.09
90,000
JA Solar
15
30
Trina Solar
15
35
Inverters
0.040
40,000
0.042
42,000
0.042
42,000
Canadian Solar
11.3
20
Risen Energy
10
20
Cable
0.035
35,000
0.043
43,000
0.043
43,000
Q Cell
6.5
First Solar
5.7
Logistics
0.009
9,000
0.06
60,000
0.035
35,000
Civil works
0.027
27,000
0.027
27,000
0.027
27,000
GCL-SI
Rest
3.5
8 5
6.7
44
44
154
244
Others BoP
0.01
10,000
0.013
13,000
0.013
13,000
58% ↑
Total
400,000
0.535
535,000
0.480
480,000
Total new Solar PV Installed capacity (GW)
IEA forecast
Expected to continue growing in 2022
135
183
228
Exchange rate
1.14
1.21
1.05
•
2022
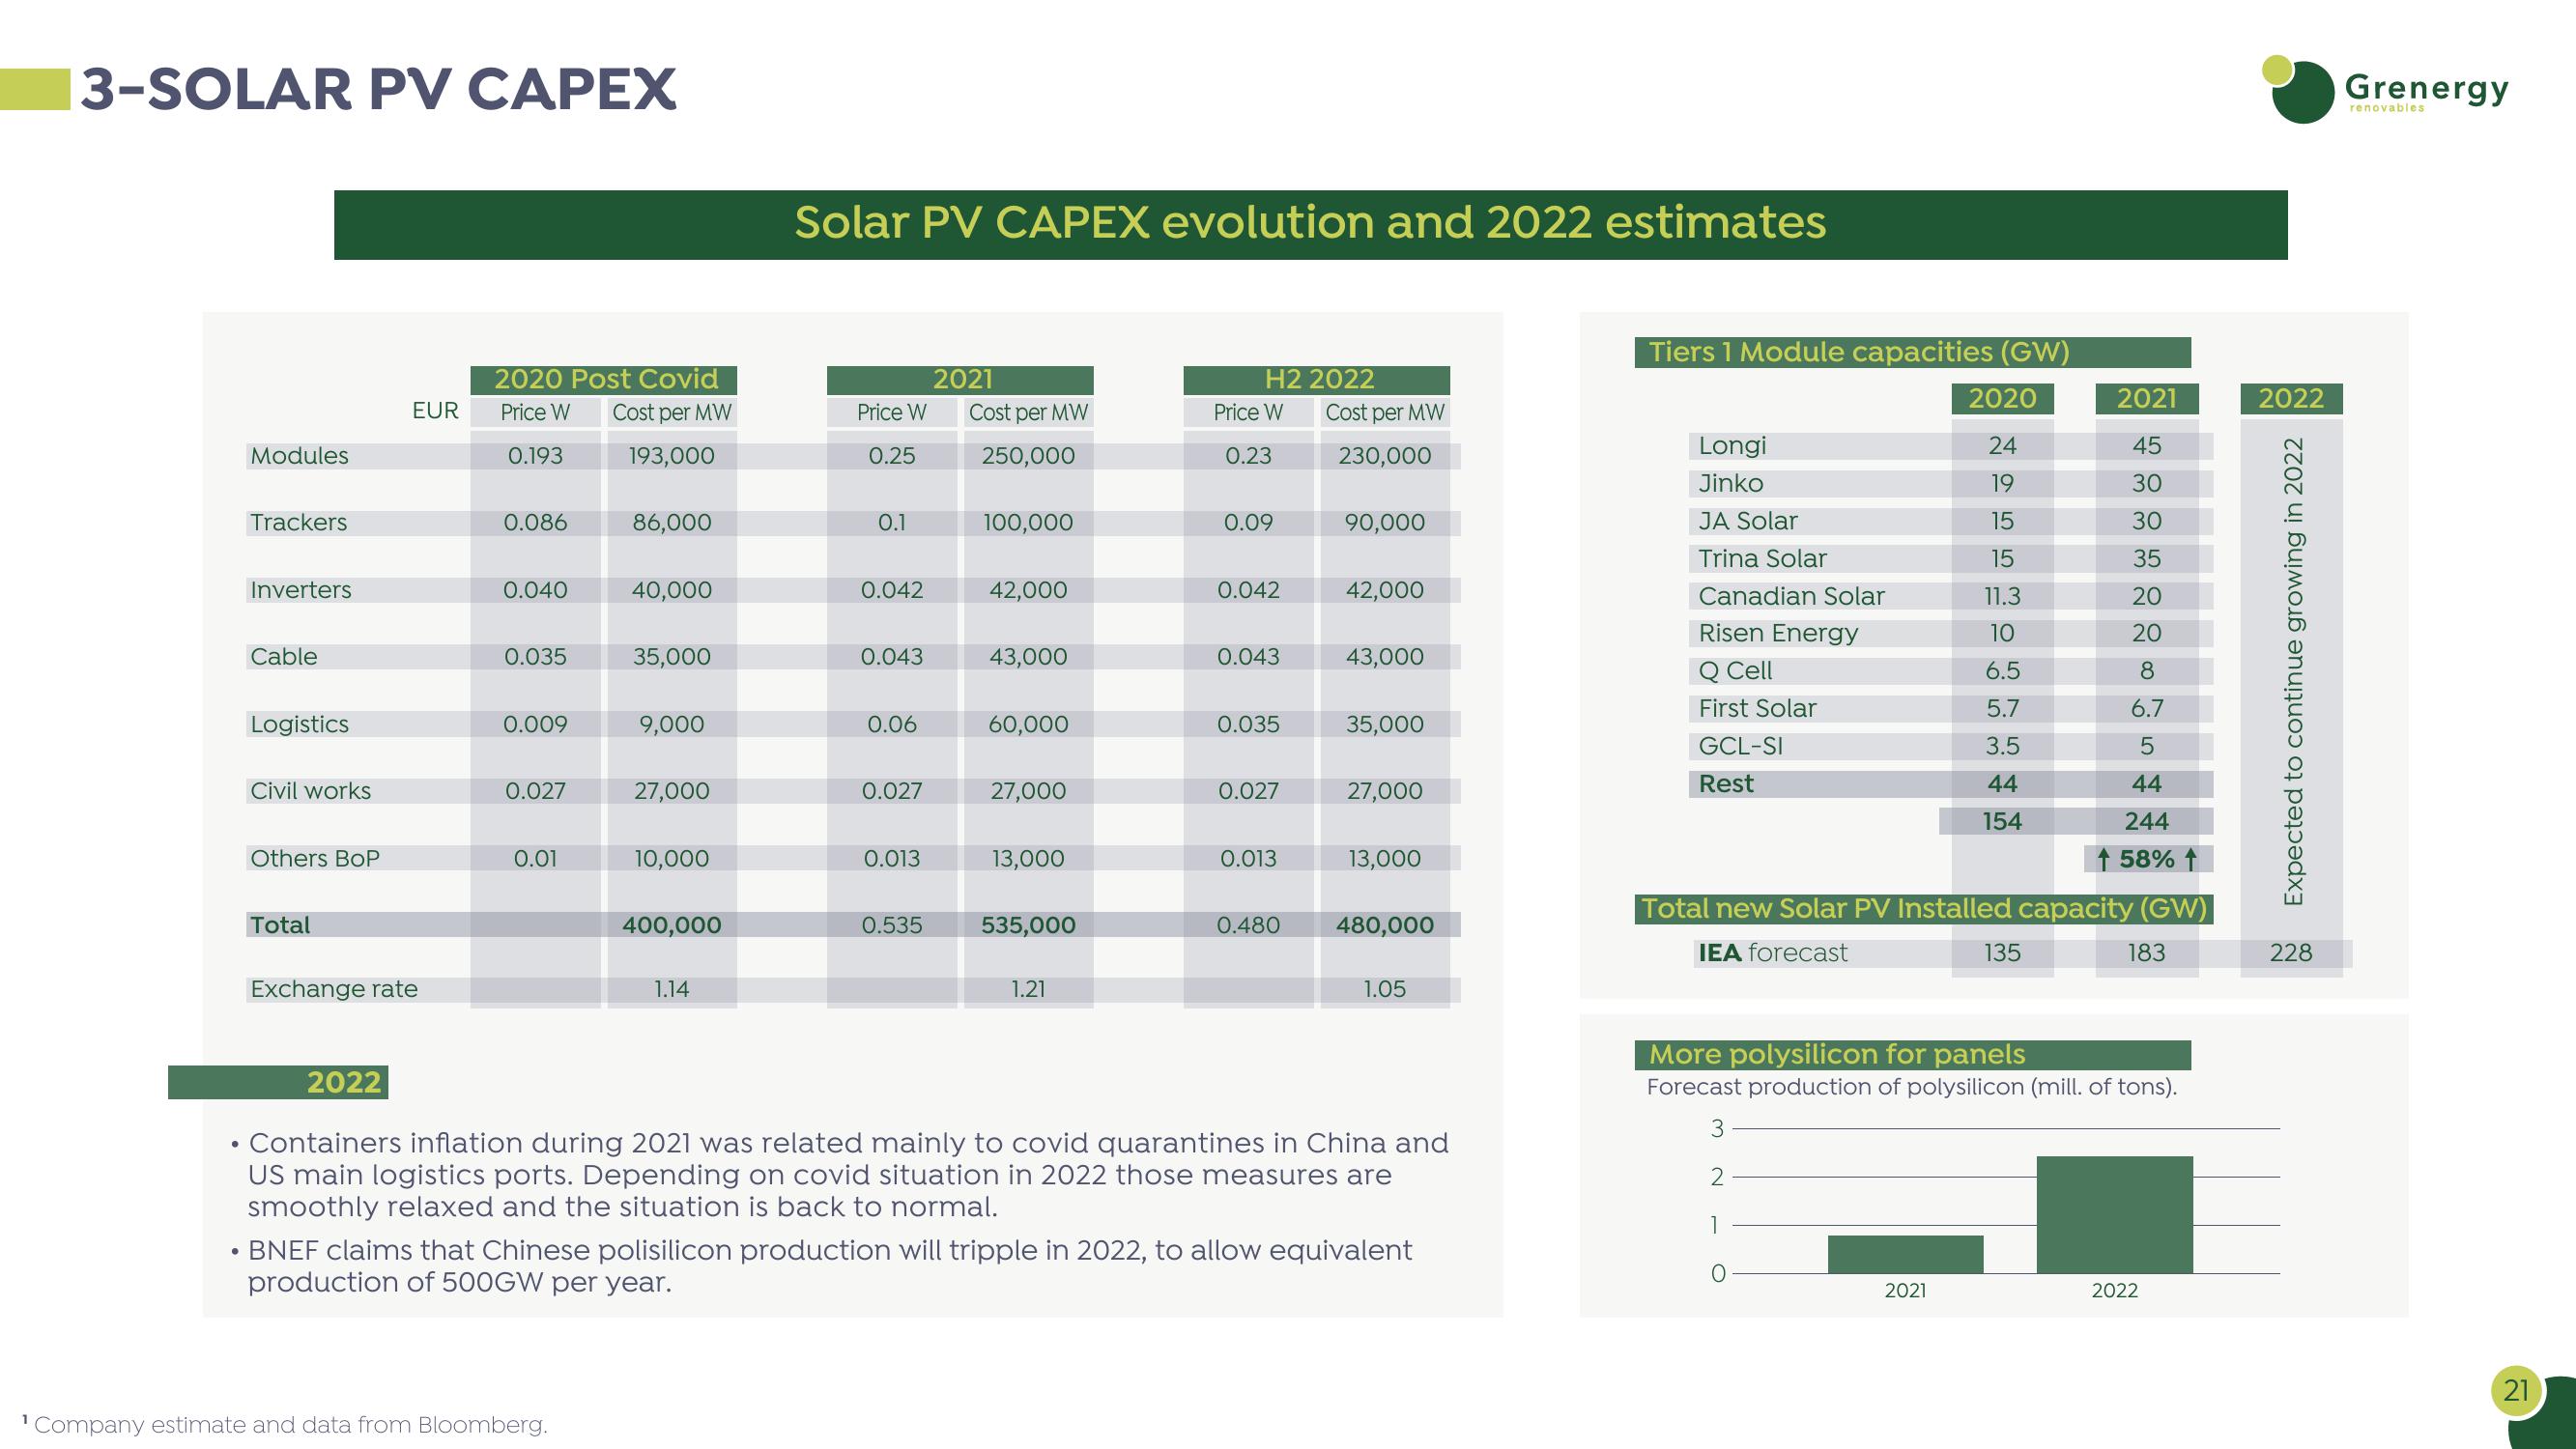
Containers inflation during 2021 was related mainly to covid quarantines in China and
US main logistics ports. Depending on covid situation in 2022 those measures are
smoothly relaxed and the situation is back to normal.
⚫ BNEF claims that Chinese polisilicon production will tripple in 2022, to allow equivalent
production of 500GW per year.
More polysilicon for panels
Forecast production of polysilicon (mill. of tons).
3
2
1
0
2021
2022
Company estimate and data from Bloomberg.
Grenergy
renovables
21View entire presentation