Experian ESG Presentation Deck
Executive Summary
Improving Financial Health
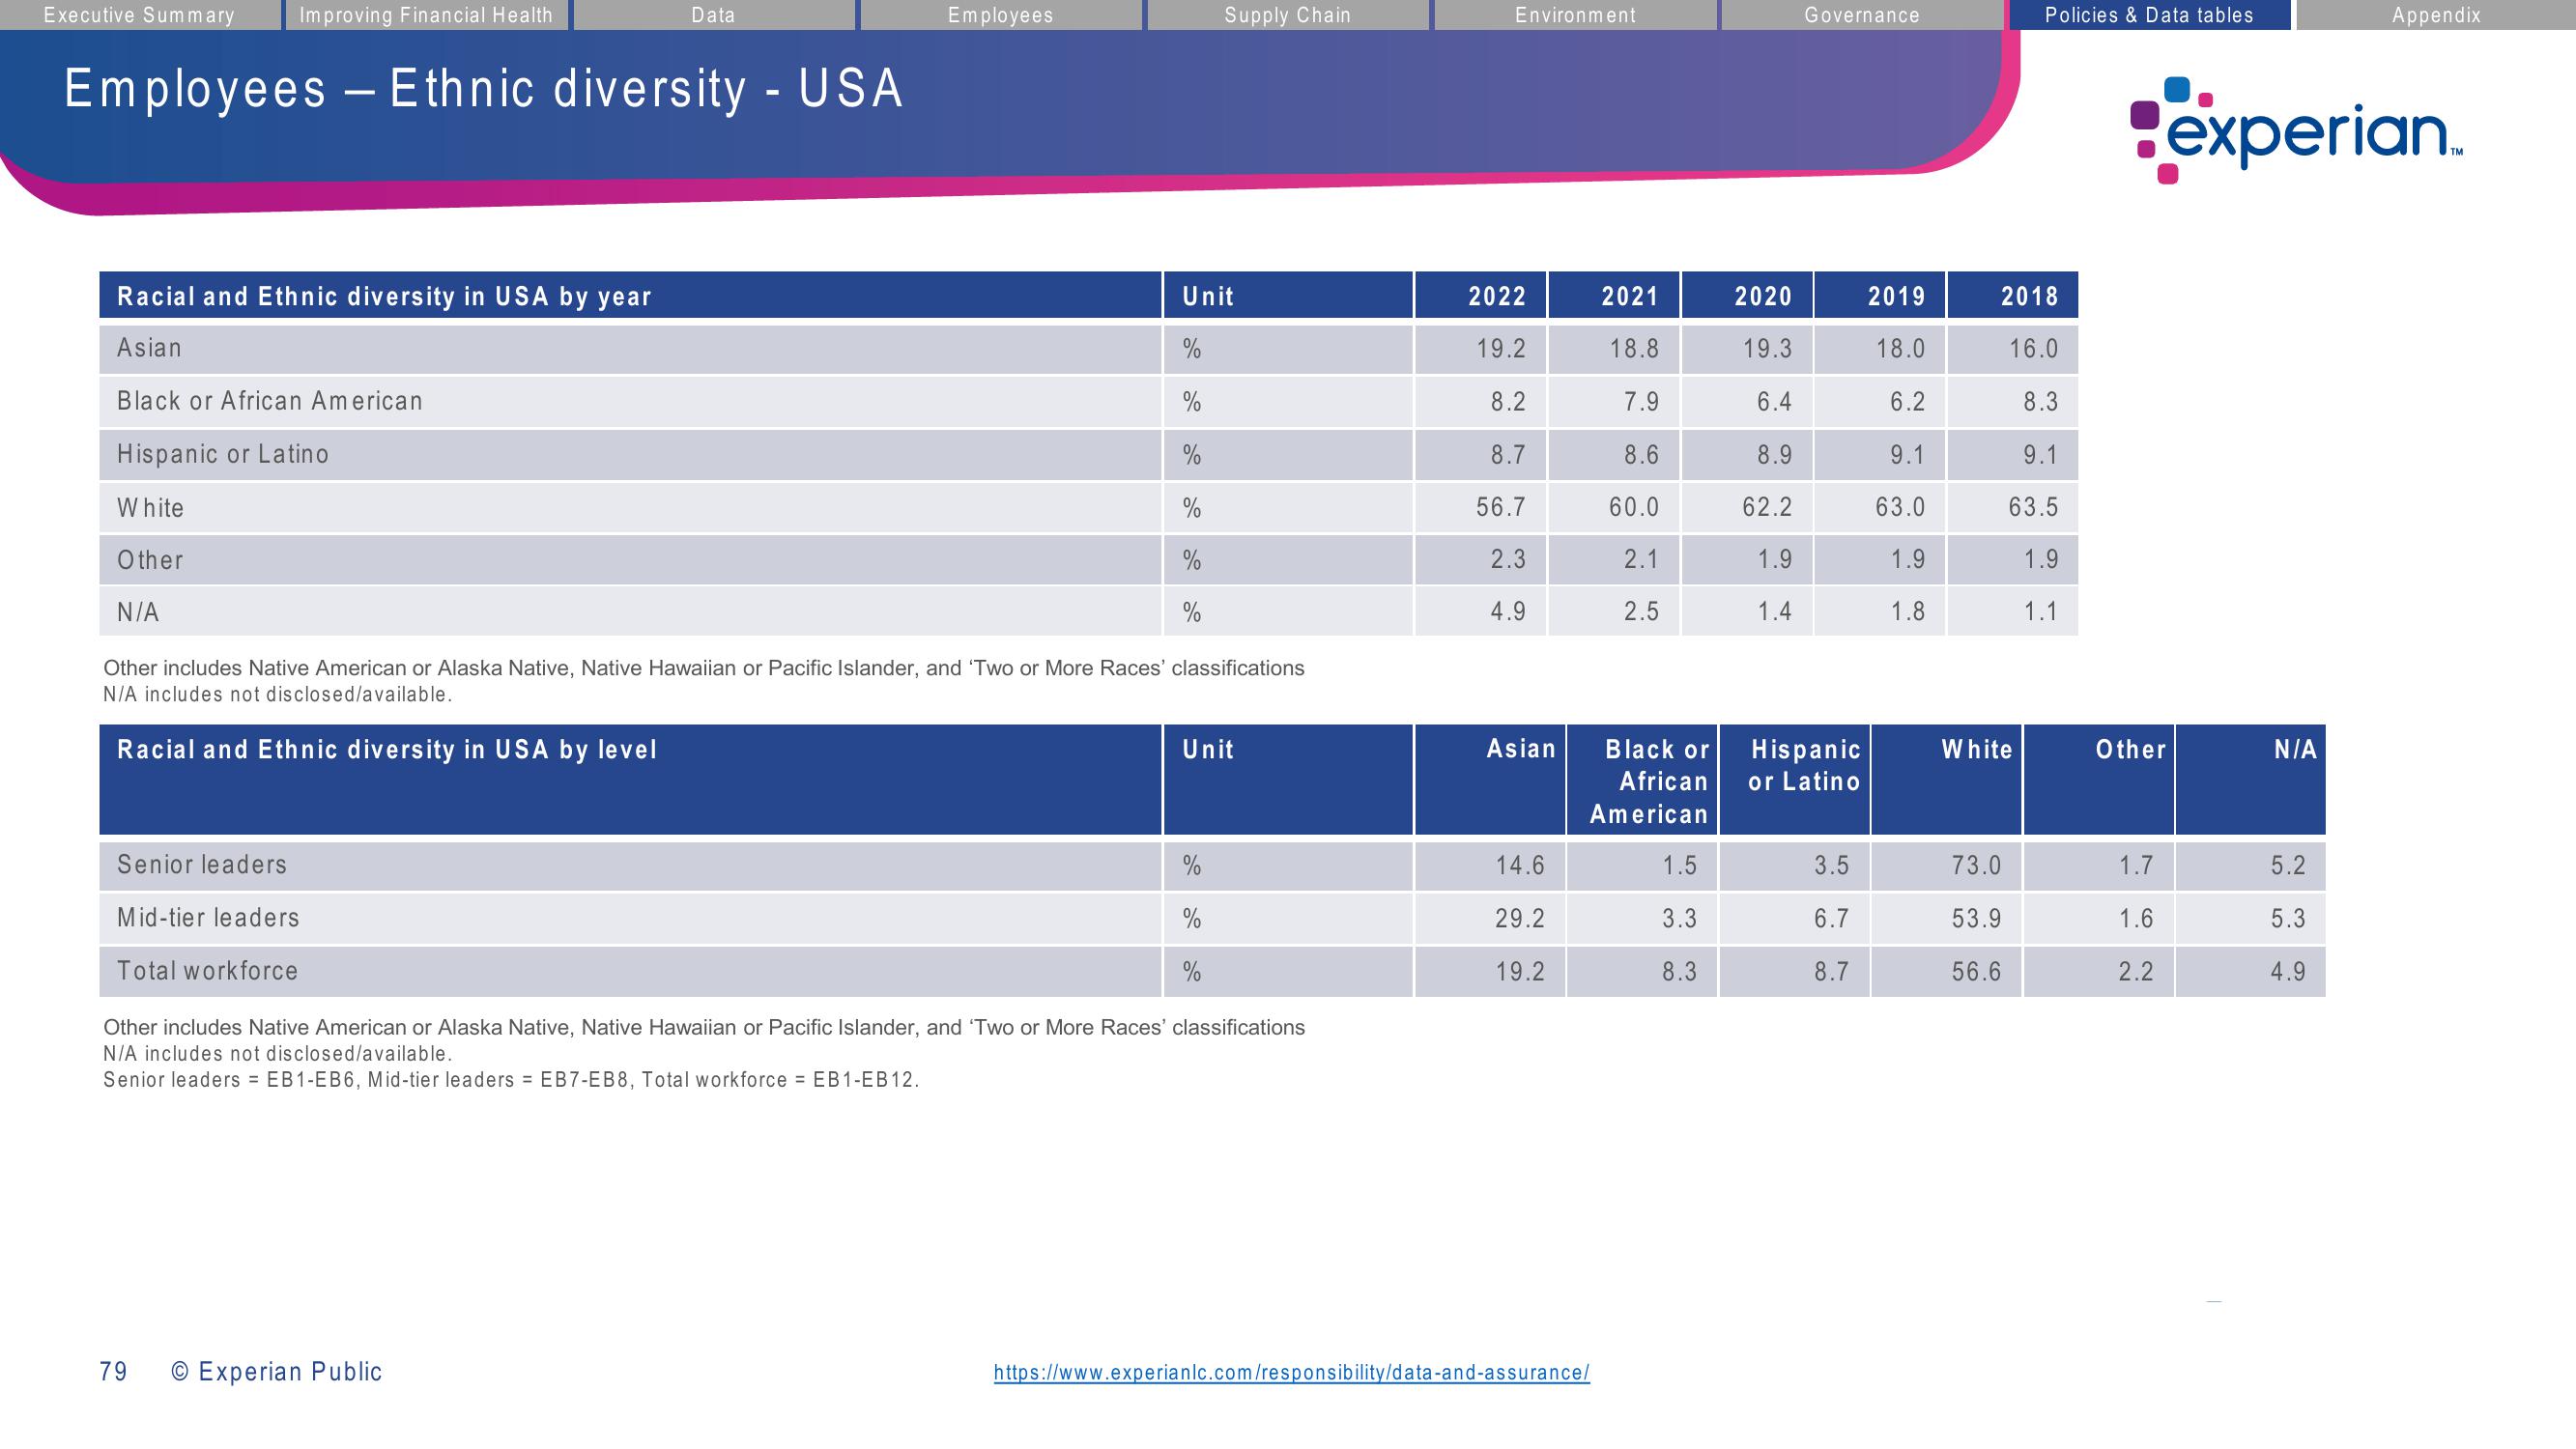
Employees - Ethnic diversity - USA
Racial and Ethnic diversity in USA by year
Asian
Black or African American
Hispanic or Latino
White
Other
N/A
Senior leaders
Mid-tier leaders
Total workforce
Data
79
Employees
O Experian Public
Unit
%
%
%
Other includes Native American or Alaska Native, Native Hawaiian or Pacific Islander, and 'Two or More Races' classifications
N/A includes not disclosed/available.
Racial and Ethnic diversity in USA by level
%
Supply Chain
Unit
%
%
%
Other includes Native American or Alaska Native, Native Hawaiian or Pacific Islander, and 'Two or More Races' classifications
N/A includes not disclosed/available.
Senior leaders = EB1-EB6, Mid-tier leaders = EB7-EB8, Total workforce = EB1-EB12.
Environment
2022
19.2
8.2
8.7
56.7
2.3
4.9
Asian
14.6
29.2
19.2
2021
18.8
7.9
8.6
60.0
2.1
2.5
Black or
African
American
https://www.experianlc.com/responsibility/data-and-assurance/
1.5
3.3
8.3
2020
19.3
6.4
8.9
62.2
1.9
1.4
Governance
Hispanic
or Latino
3.5
6.7
8.7
2019
18.0
6.2
9.1
63.0
1.9
1.8
2018
16.0
8.3
9.1
63.5
1.9
1.1
White
Policies & Data tables
73.0
53.9
56.6
Other
1.7
1.6
2.2
experian.
N/A
N
Appendix
5.2
5.3
4.9View entire presentation