Spotify Results Presentation Deck
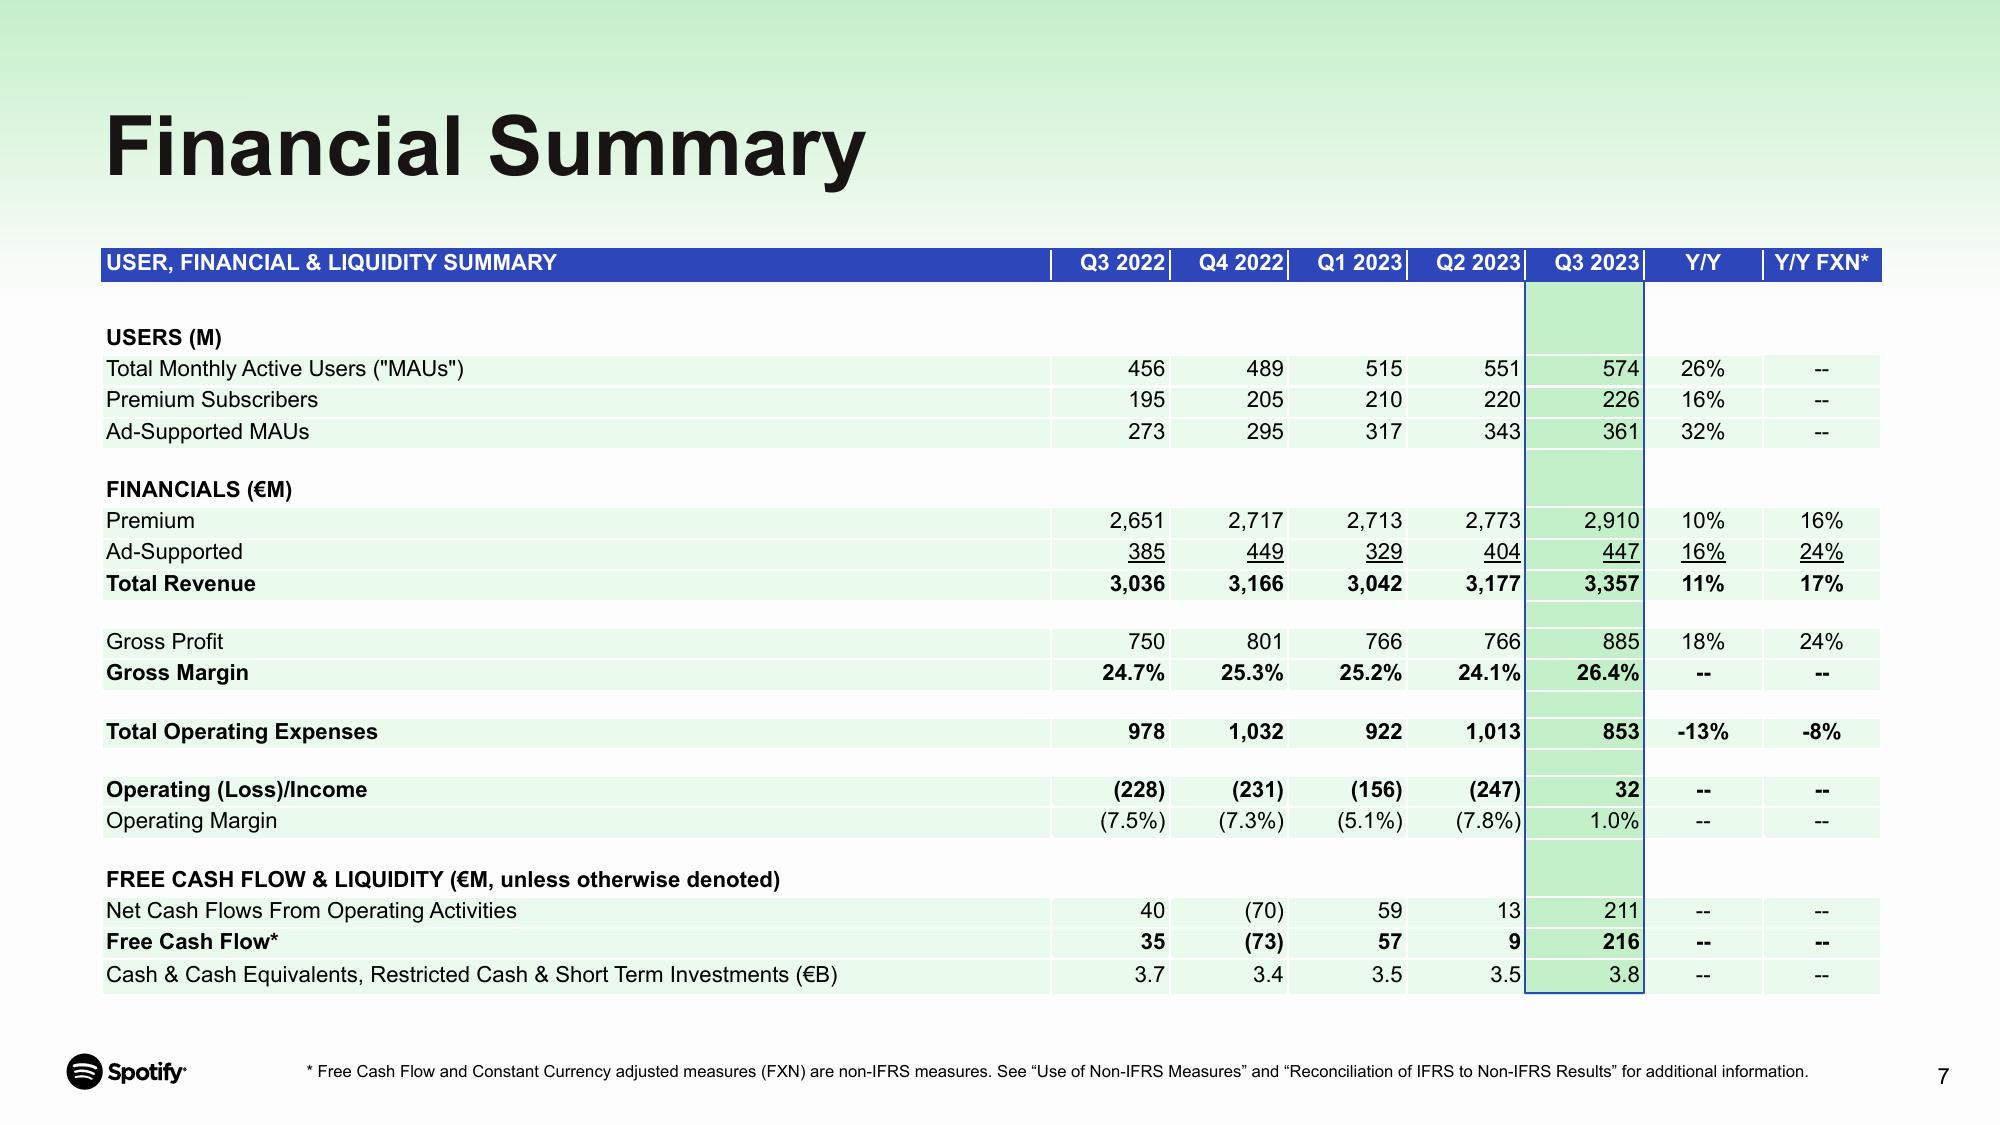
Financial Summary
USER, FINANCIAL & LIQUIDITY SUMMARY
USERS (M)
Total Monthly Active Users ("MAUS")
Premium Subscribers
Ad-Supported MAUS
FINANCIALS (€M)
Premium
Ad-Supported
Total Revenue
Gross Profit
Gross Margin
Total Operating Expenses
Operating (Loss)/Income
Operating Margin
FREE CASH FLOW & LIQUIDITY (EM, unless otherwise denoted)
Net Cash Flows From Operating Activities
Free Cash Flow*
Cash & Cash Equivalents, Restricted Cash & Short Term Investments (€B)
Spotify
Q3 2022
456
195
273
2,651
385
3,036
750
24.7%
978
(228)
(7.5%)
40
35
3.7
Q4 2022
489
205
295
2,717
449
3,166
801
25.3%
Q1 2023
(70)
(73)
3.4
515
210
317
2,713
329
3,042
766
25.2%
922
Q2 2023
59
57
3.5
551
220
343
1,032
(231)
(156)
(247)
(7.3%) (5.1%) (7.8%)
2,773
404
3,177
766
24.1%
1,013
13
9
3.5
Q3 2023
574
26%
16%
226
361 32%
2,910
447
3,357
885
26.4%
853
32
1.0%
Y/Y
211
216
3.8
10%
16%
11%
18%
--
-13%
11
Y/Y FXN*
16%
24%
17%
24%
--
-8%
* Free Cash Flow and Constant Currency adjusted measures (FXN) are non-IFRS measures. See "Use of Non-IFRS Measures" and "Reconciliation of IFRS to Non-IFRS Results" for additional information.
--
7View entire presentation