UBS Results Presentation Deck
Personal & Corporate Banking (CHF)
Profit before tax
m
Operating
income
m
Cost/income ratio
UBS
Transaction-based
income
Net interest
income
Recurring net fee
income
305
850
///////////
264
472
170
(84)
Other income
58%
3Q20
318
896
230
455
177
20
+44%
66%
4Q20
358
+18%
950
239
470
182
22
456
64%
1Q21
1,037
288
480
Credit loss (expenses)/releases
187
42
58%
2Q21
439
1,002
281
494
201
57%
3Q21
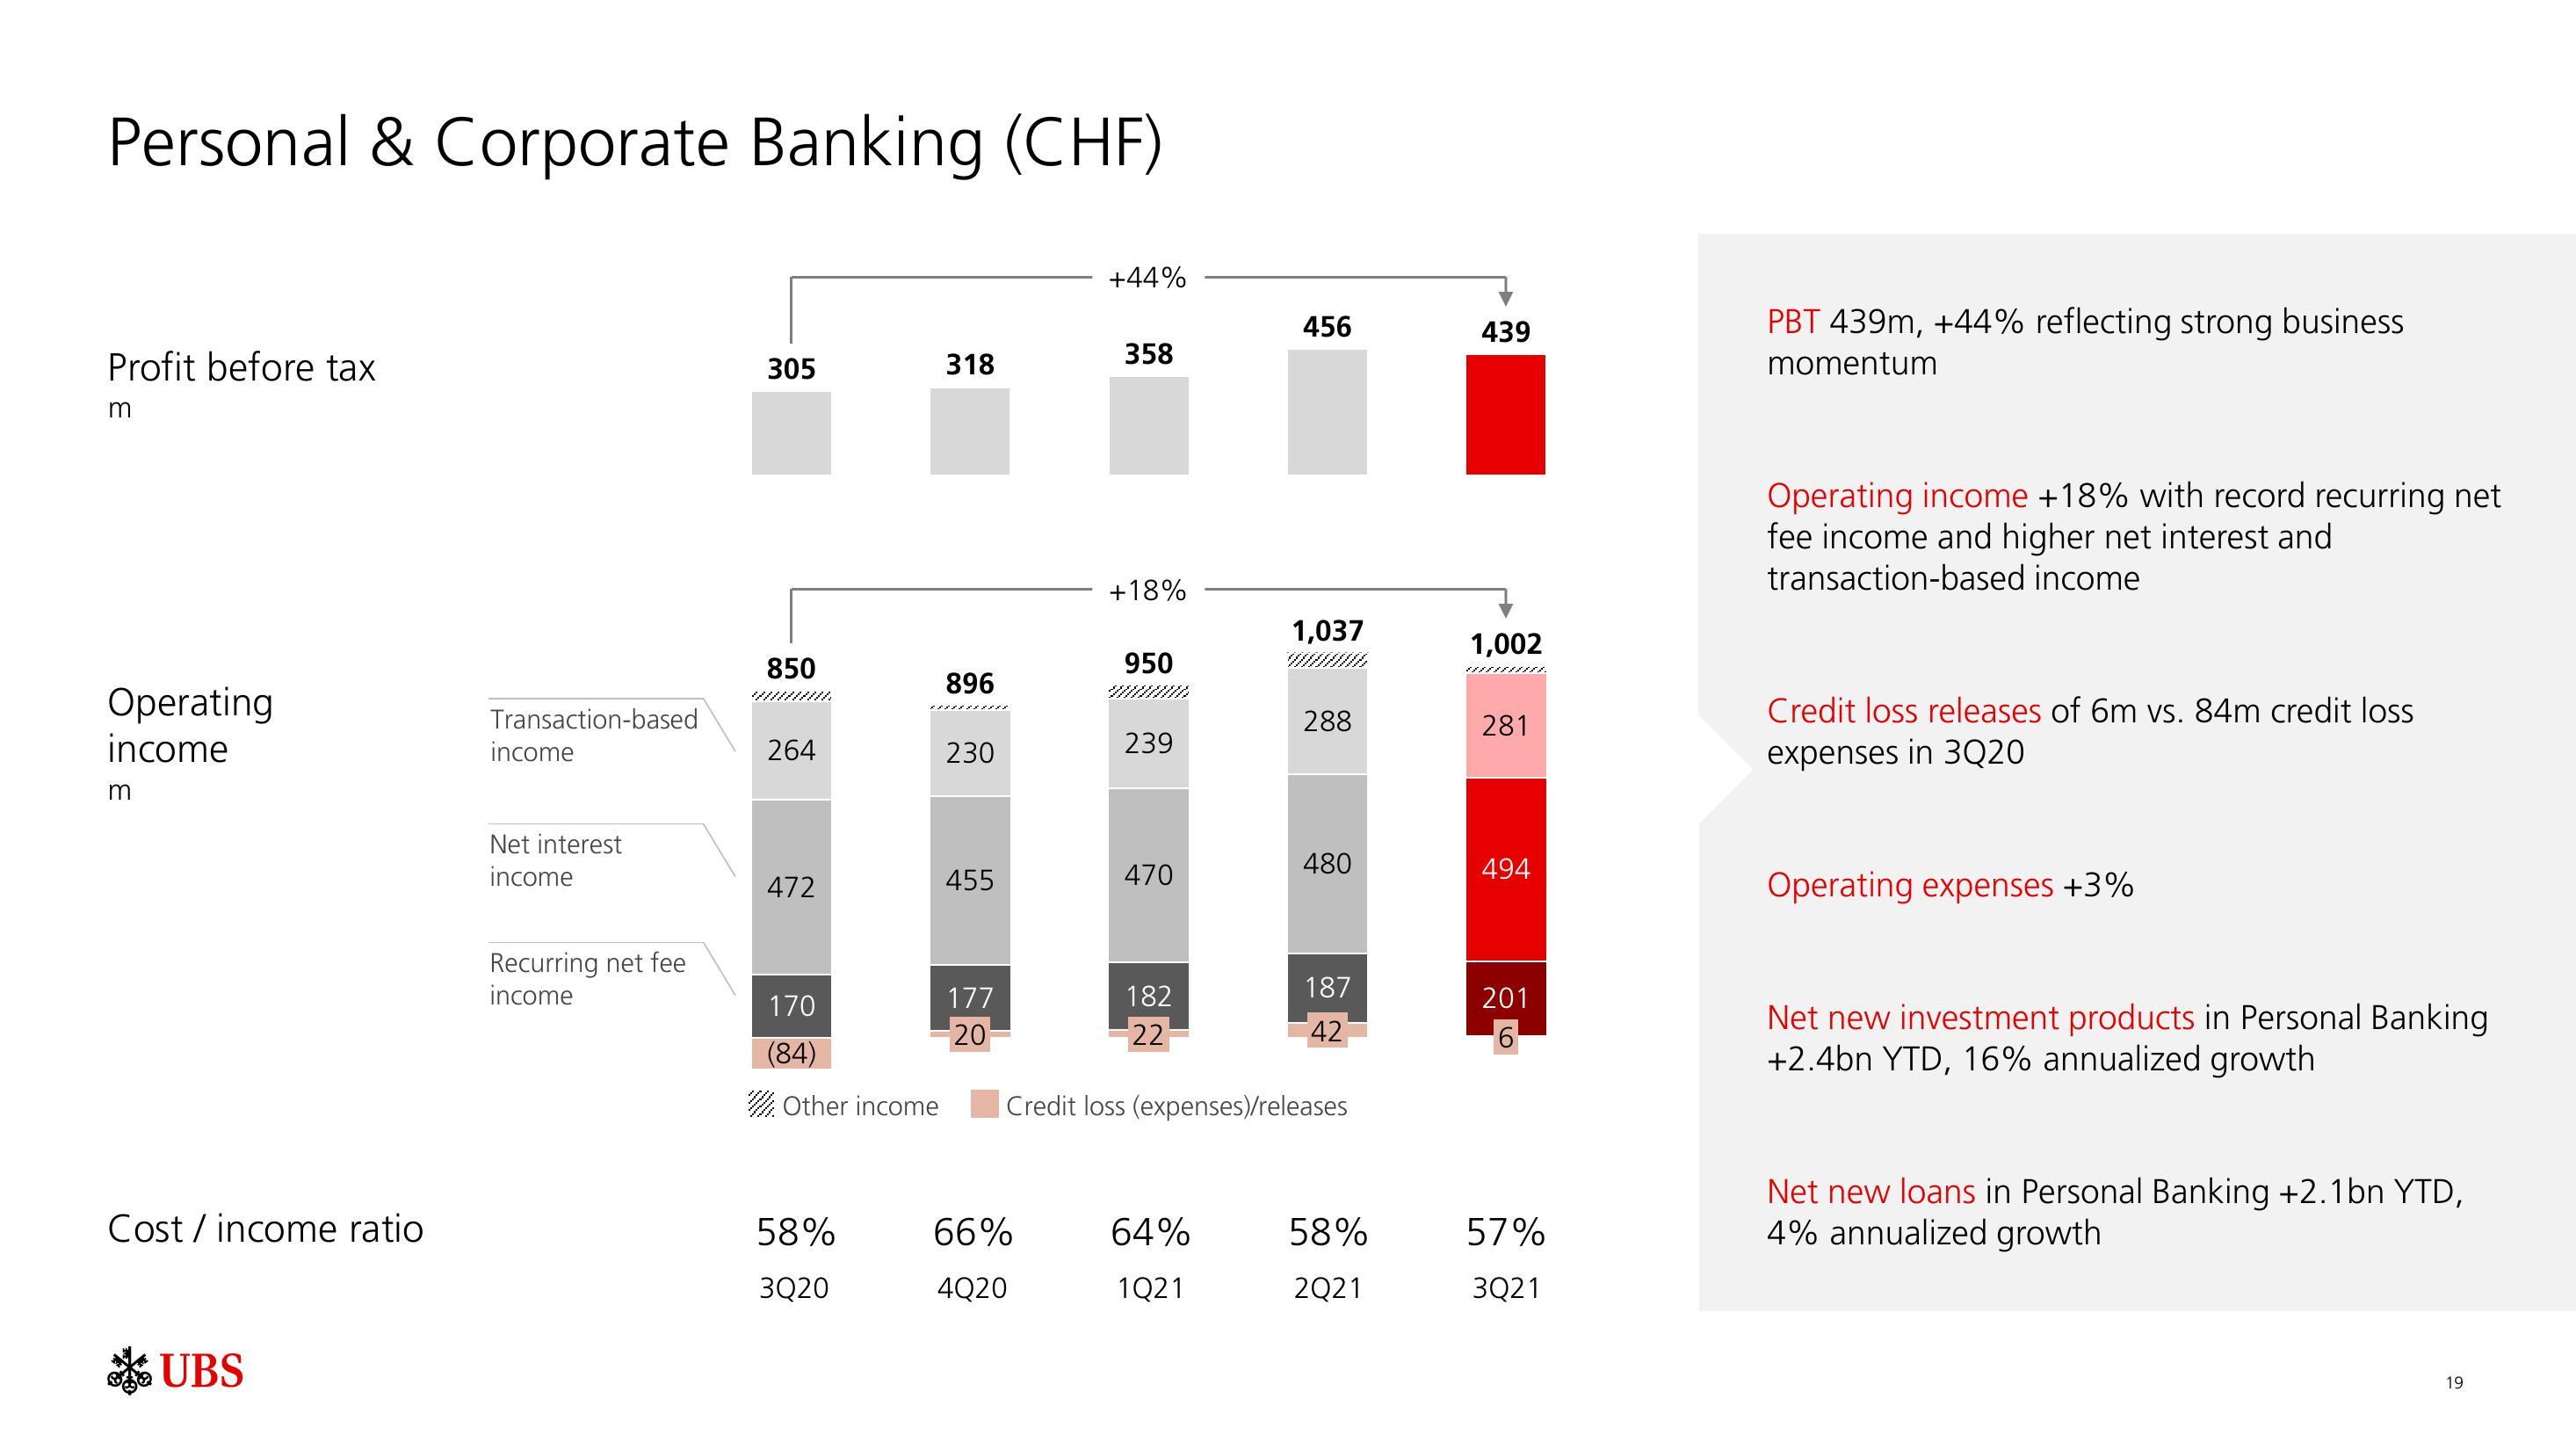
PBT 439m, +44% reflecting strong business
momentum
Operating income +18% with record recurring net
fee income and higher net interest and
transaction-based income
Credit loss releases of 6m vs. 84m credit loss
expenses in 3Q20
Operating expenses +3%
Net new investment products in Personal Banking
+2.4bn YTD, 16% annualized growth
Net new loans in Personal Banking +2.1bn YTD,
4% annualized growth
19View entire presentation