Bridge Investment Group Results Presentation Deck
ΤΗ
4
QUARTER AND FULL YEAR 2022 OVERVIEW
YOY Change
%
Financial
Highlights
Key
Operating
Metrics
Business
Update
($ in MM, except per share data or as noted)
Total Revenue
GAAP Net Income
Earnings (Loss) per share
Fee Related Earnings ("FRE") to the
Operating Company'
Distributable Earnings ("DE") of the
Operating Company"
After-tax DE per share¹
Gross AUM
Fee-Earning AUM
Capital Raised
Capital Deployed
Dry Powder
Realized Performance Allocations
Unrealized Accrued Performance
Allocations
.
Q4 2022
$95.5
$18.2
$(0.04)
$30.9
$35.6
$0.21
Q4 2022
$43.3 Bn
$17.3 Bn
$0.5 Bn
$1.0 Bn
$3.5 Bn
$4.5
$554.7
Q4 2021
$107.3
$165.8
$0.52
$35.5
$38.7
$0.26
BRIDGE INVESTMENT GROUP
Q4 2021
$36.3 Bn
$13.4 Bn
$2.3 Bn
$2.1 Bn
$2.7 Bn
$10.3
$439.5
(11)%
(89)%
(108)%
(13)%
(8)%
(19)%
YOY Change
%
19%
30%
(77)%
(52)%
30%
(57%)
26%
FY 2022
$409.0
$272.4
$0.92
$158.3
$187.9
$1.10
FY 2022
$43.3 Bn
$17.3 Bn
$4.5 Bn
$3.2 Bn
$3.5 Bn
$69.3
$554.7
FY 2021
$330.0
$408.6
$0.93
$105.3
$134.6
$0.89
FY 2021
$36.3 Bn
$13.4 Bn
$5.0 Bn
$4.6 Bn
$2.7 Bn
$83.4
$439.5
For the year ended December 31, 2021 the pro forma information assumes the Transactions and IPO occurred prior to reported period.
YOY Change
%
24%
(33)%
(1)%
50%
40%
24%
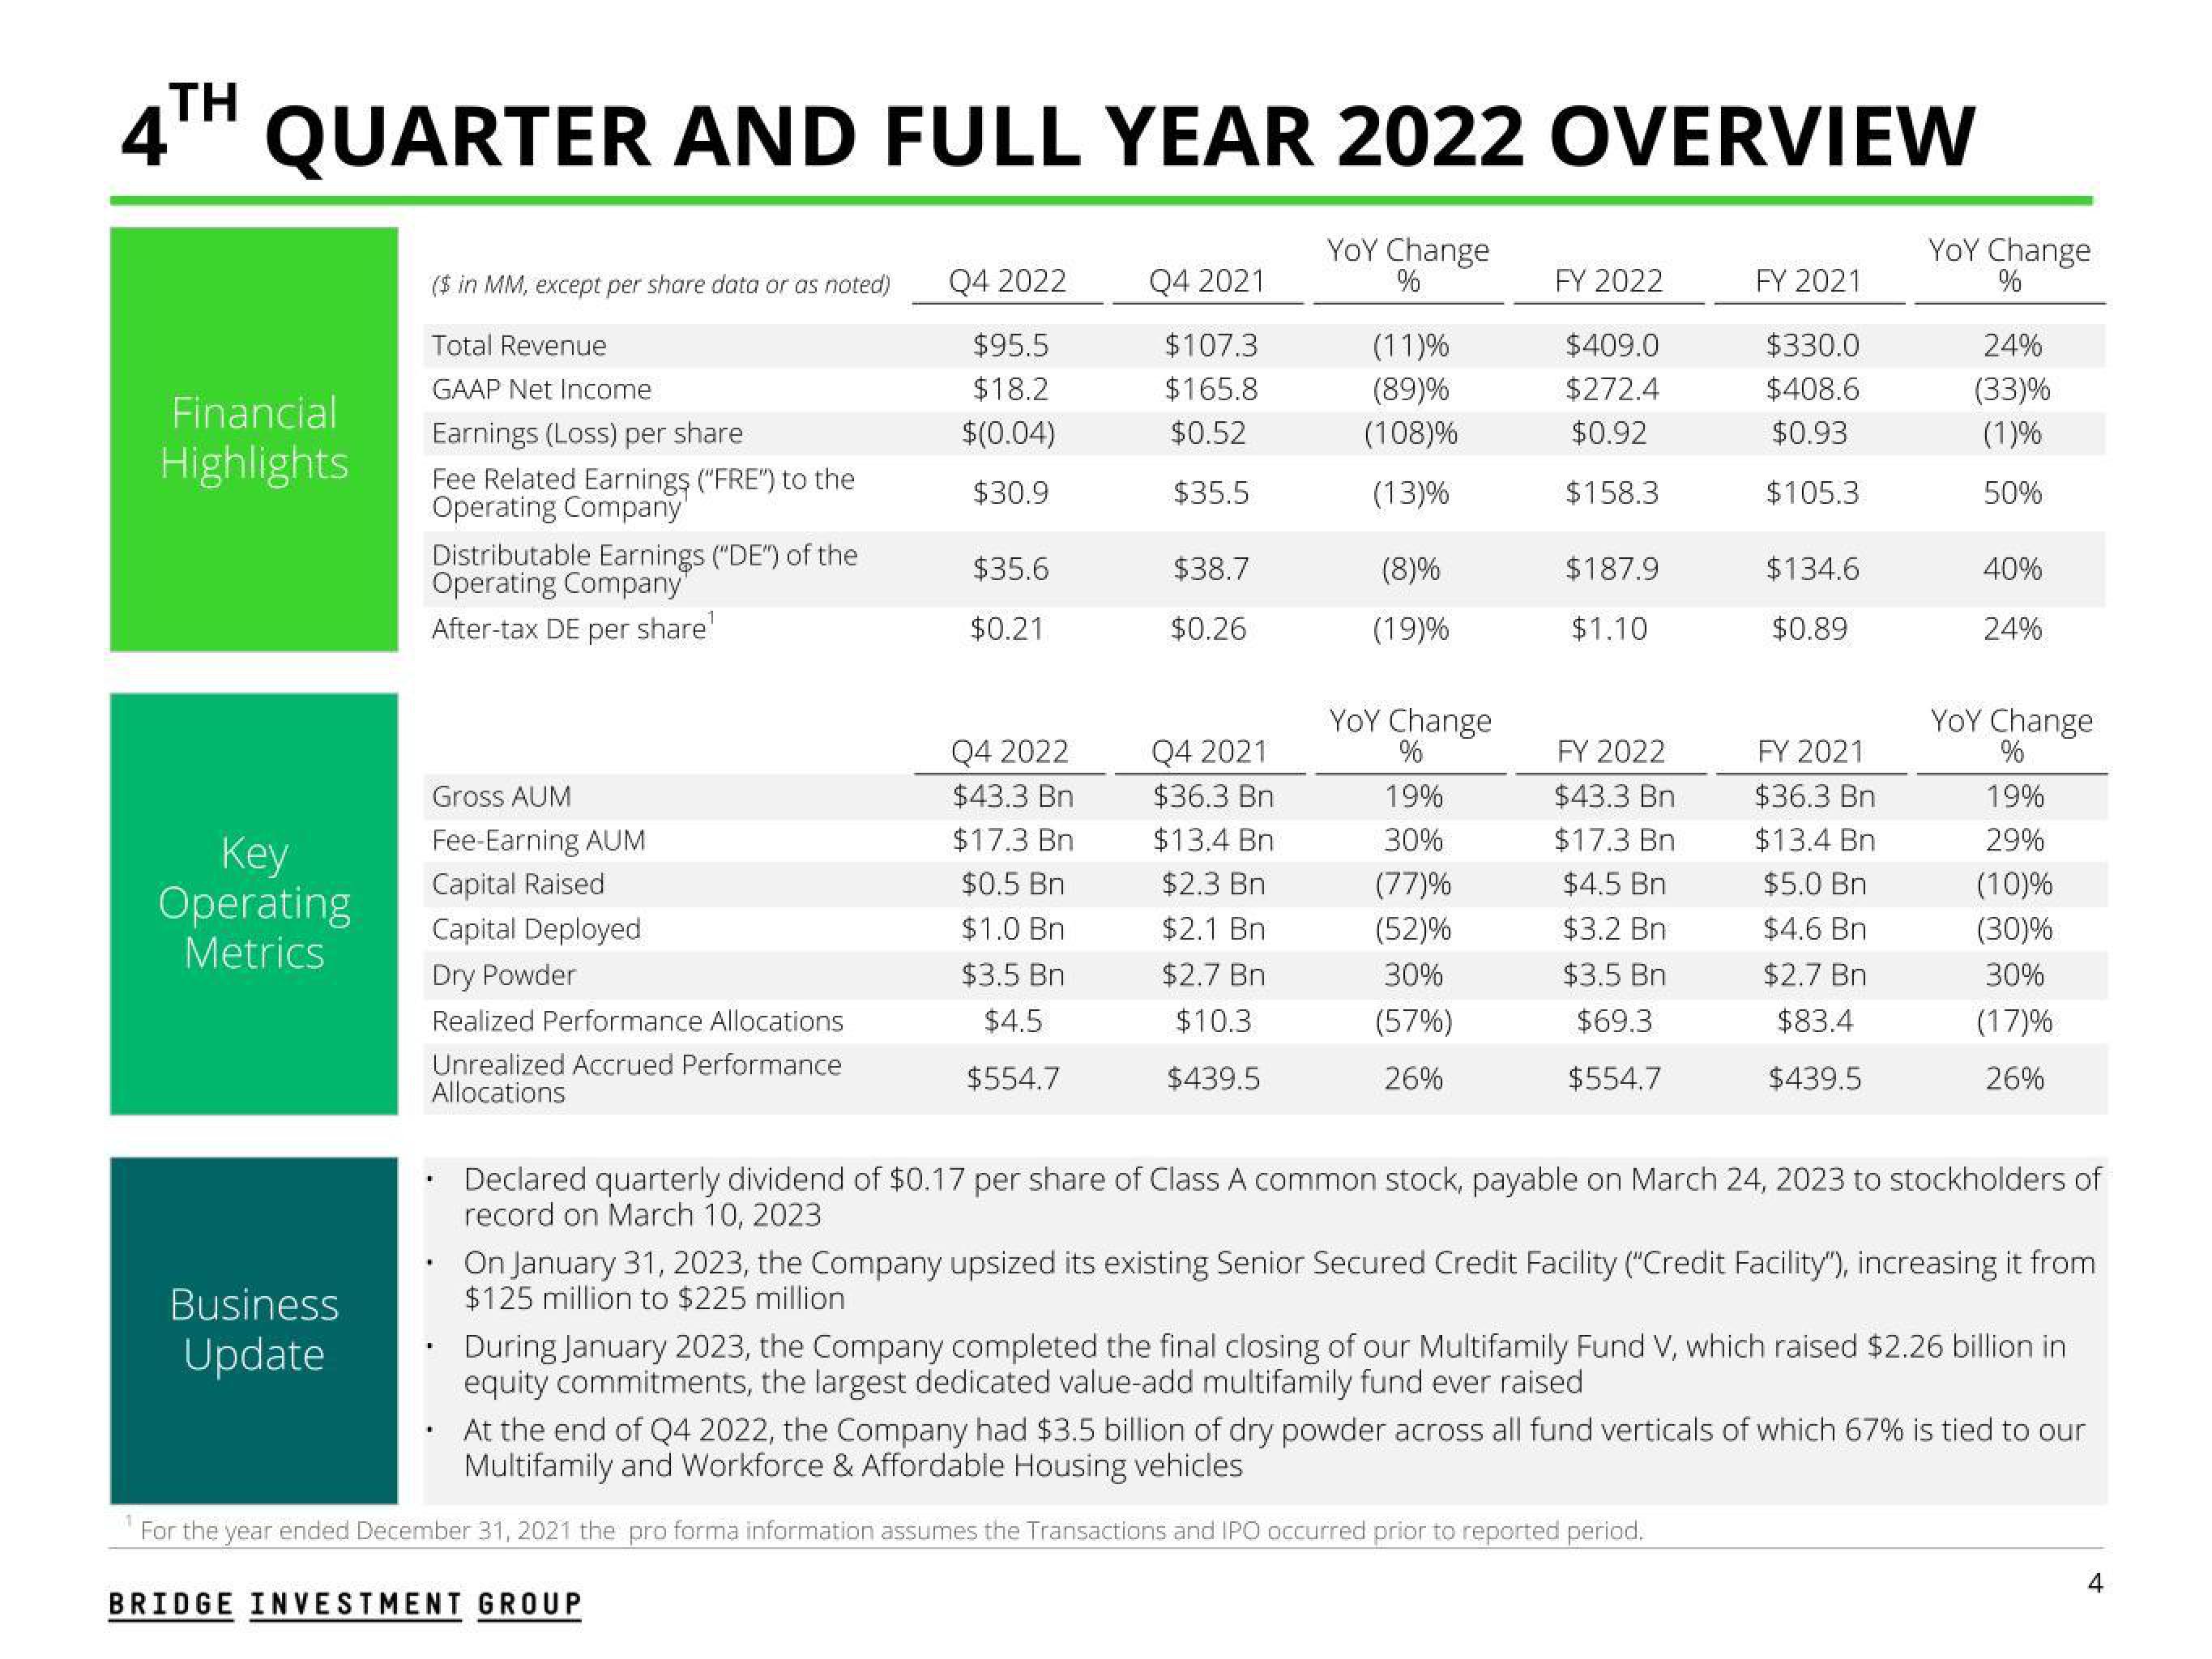
Declared quarterly dividend of $0.17 per share of Class A common stock, payable on March 24, 2023 to stockholders of
record on March 10, 2023
YOY Change
%
19%
29%
(10)%
(30)%
30%
(17)%
26%
On January 31, 2023, the Company upsized its existing Senior Secured Credit Facility ("Credit Facility"), increasing it from
$125 million to $225 million
During January 2023, the Company completed the final closing of our Multifamily Fund V, which raised $2.26 billion in
equity commitments, the largest dedicated value-add multifamily fund ever raised
At the end of Q4 2022, the Company had $3.5 billion of dry powder across all fund verticals of which 67% is tied to our
Multifamily and Workforce & Affordable Housing vehicles
4View entire presentation