PropertyGuru SPAC Presentation Deck
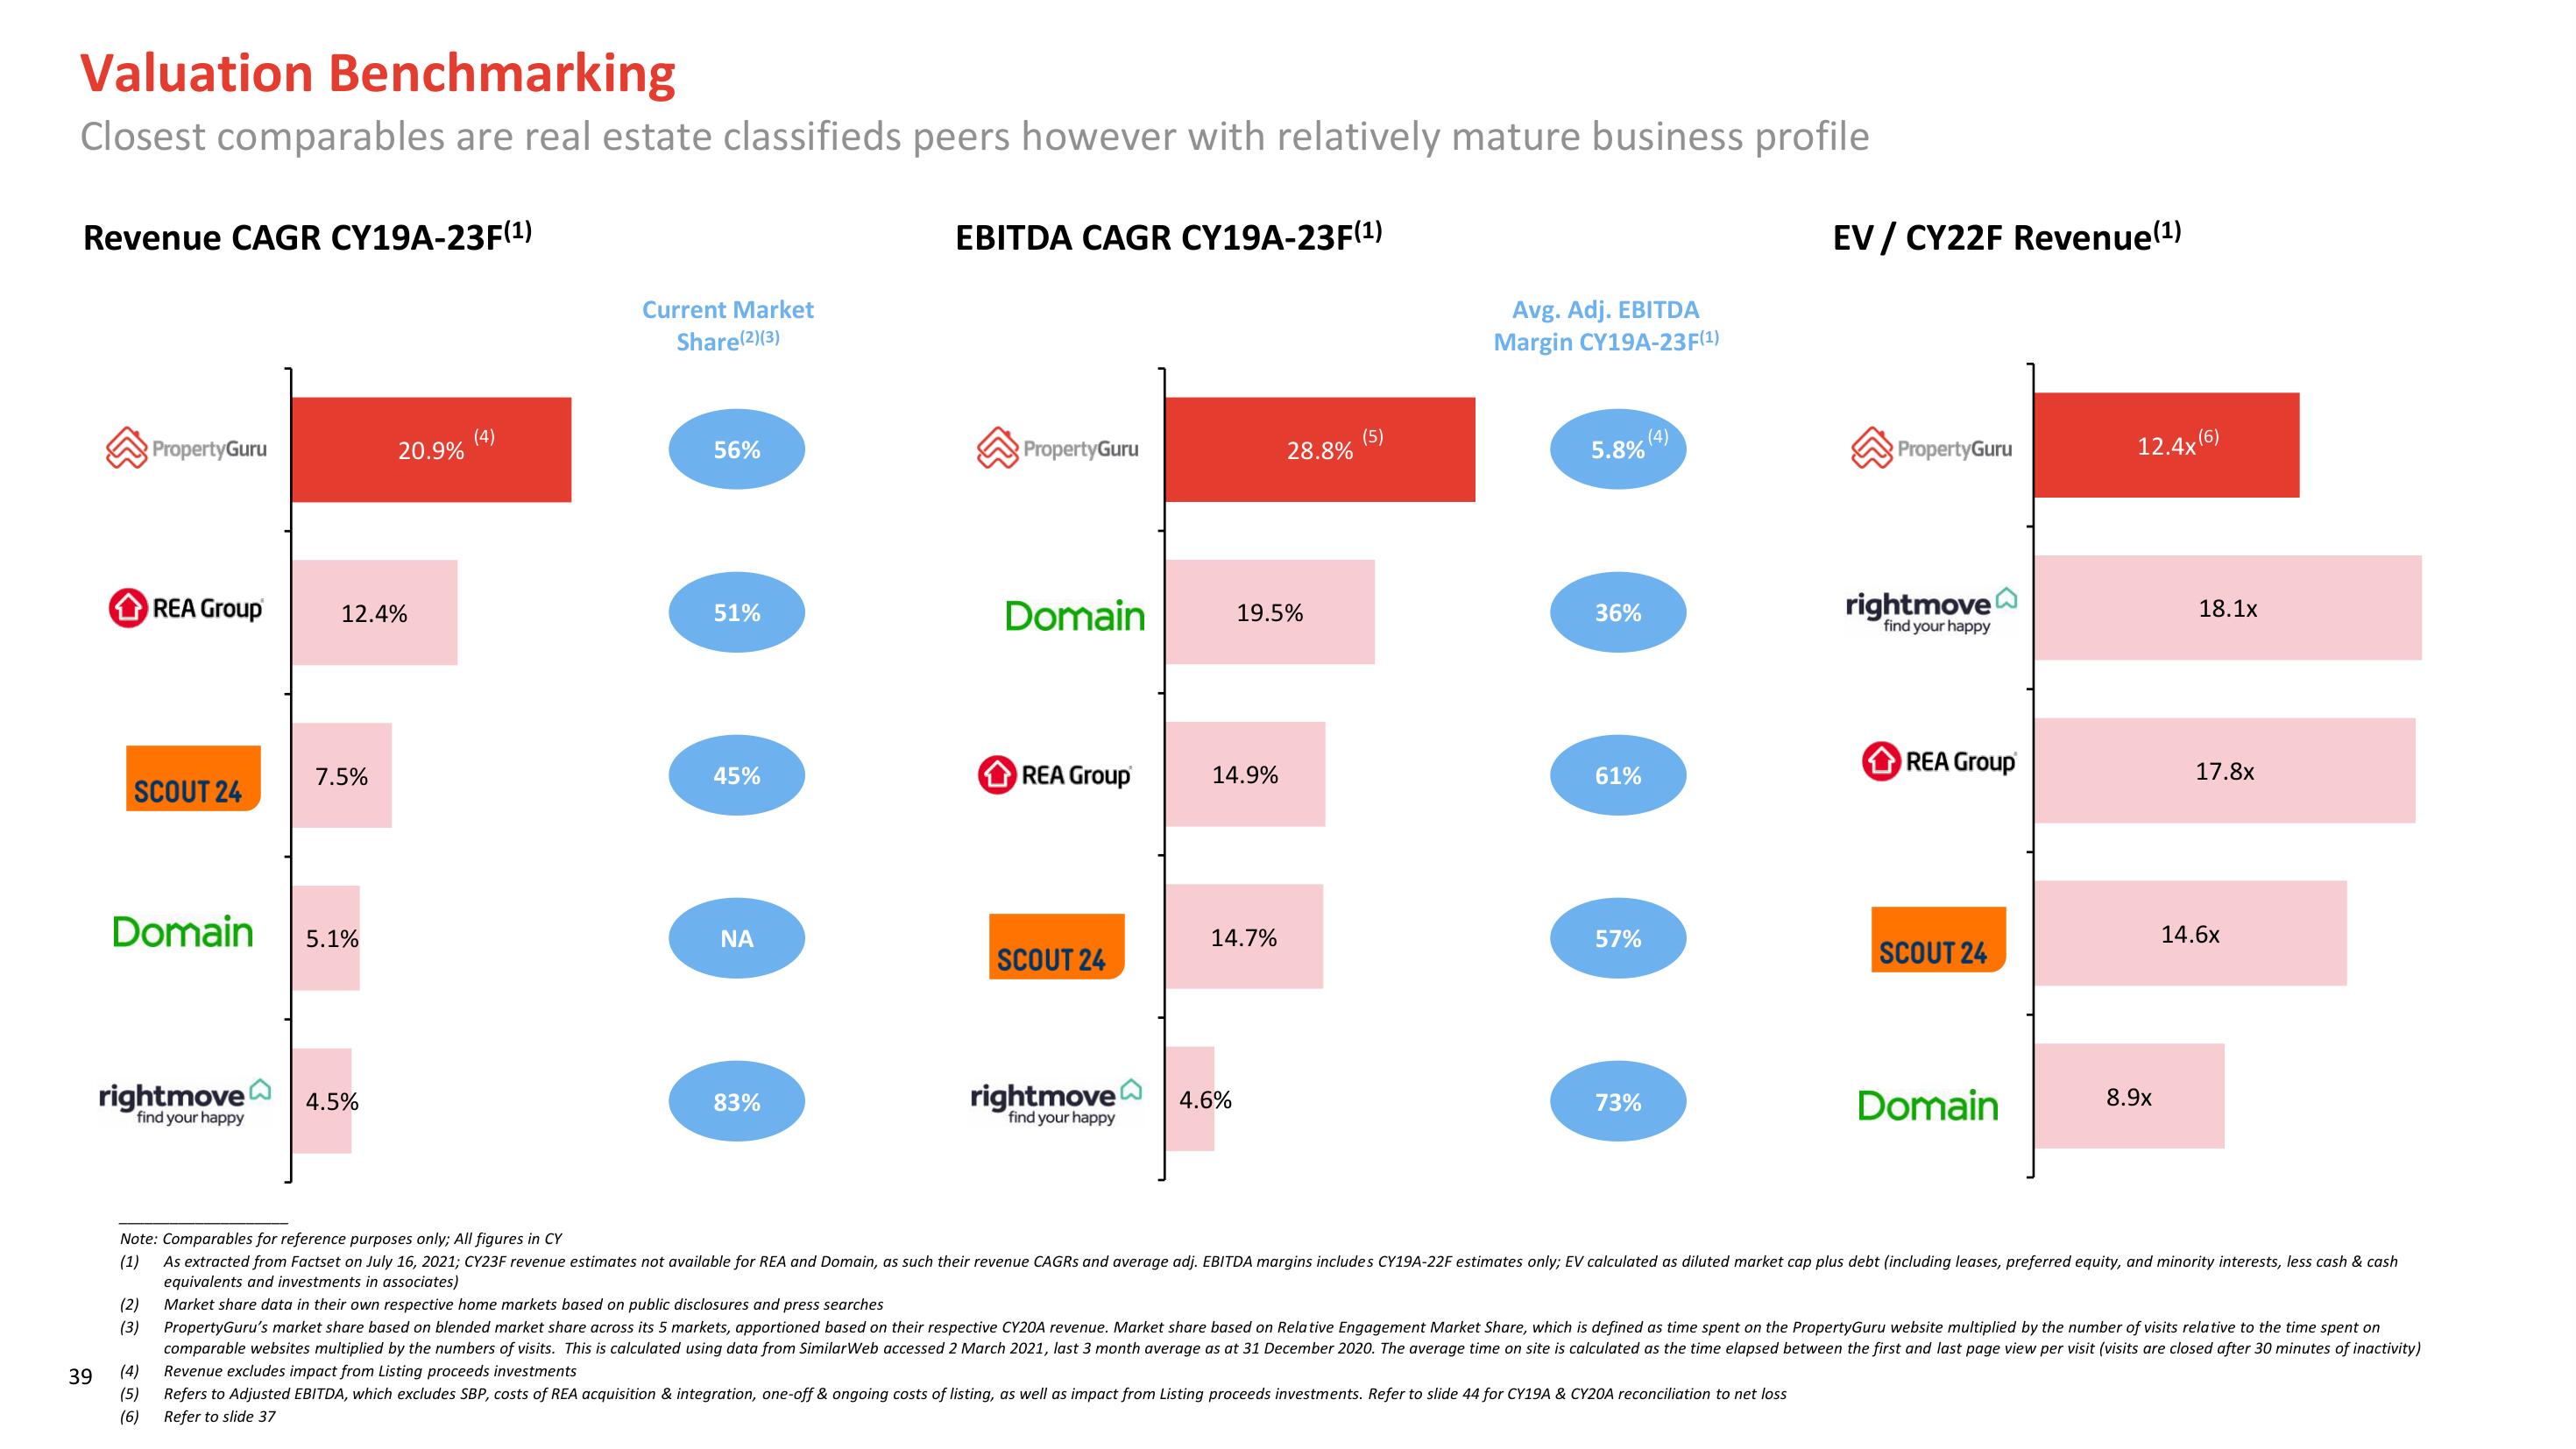
Valuation Benchmarking
Closest comparables are real estate classifieds peers however with relatively mature business profile
Revenue CAGR CY19A-23F(¹)
39
PropertyGuru
REA Group
SCOUT 24
rightmove
find your happy
(4)
(5)
(6)
Domain 5.1%
12.4%
7.5%
20.9%
4.5%
(4)
Current Market
Share(2)(3)
56%
51%
45%
ΝΑ
83%
EBITDA CAGR CY19A-23F(¹)
PropertyGuru
Domain
REA Group
SCOUT 24
rightmove
find your happy
14.9%
19.5%
14.7%
4.6%
28.8%
(5)
Avg. Adj. EBITDA
Margin CY19A-23F(¹)
5.8% (4)
36%
61%
57%
73%
EV / CY22F Revenue (¹)
PropertyGuru
rightmove
find your happy
REA Group
SCOUT 24
Domain
12.4x(6)
8.9x
18.1x
17.8x
14.6x
Note: Comparables for reference purposes only; All figures in CY
(1) As extracted from Factset on July 16, 2021; CY23F revenue estimates not available for REA and Domain, as such their revenue CAGRS and average adj. EBITDA margins includes CY19A-22F estimates only; EV calculated as diluted market cap plus debt (including leases, preferred equity, and minority interests, less cash & cash
equivalents and investments in associates)
(2) Market share data in their own respective home markets based on public disclosures and press searches
(3) PropertyGuru's market share based on blended market share across its 5 markets, apportioned based on their respective CY20A revenue. Market share based on Relative Engagement Market Share, which is defined as time spent on the PropertyGuru website multiplied by the number of visits relative to the time spent on
comparable websites multiplied by the numbers of visits. This is calculated using data from SimilarWeb accessed 2 March 2021, last 3 month average as at 31 December 2020. The average time on site is calculated as the time elapsed between the first and last page view per visit (visits are closed after 30 minutes of inactivity)
Revenue excludes impact from Listing proceeds investments
Refers to Adjusted EBITDA, which excludes SBP, costs of REA acquisition & integration, one-off & ongoing costs of listing, as well as impact from Listing proceeds investments. Refer to slide 44 for CY19A & CY20A reconciliation to net loss
Refer to slide 37View entire presentation