Diageo Results Presentation Deck
DELIVERING SUSTAINABLE LONG-TERM GROWTH
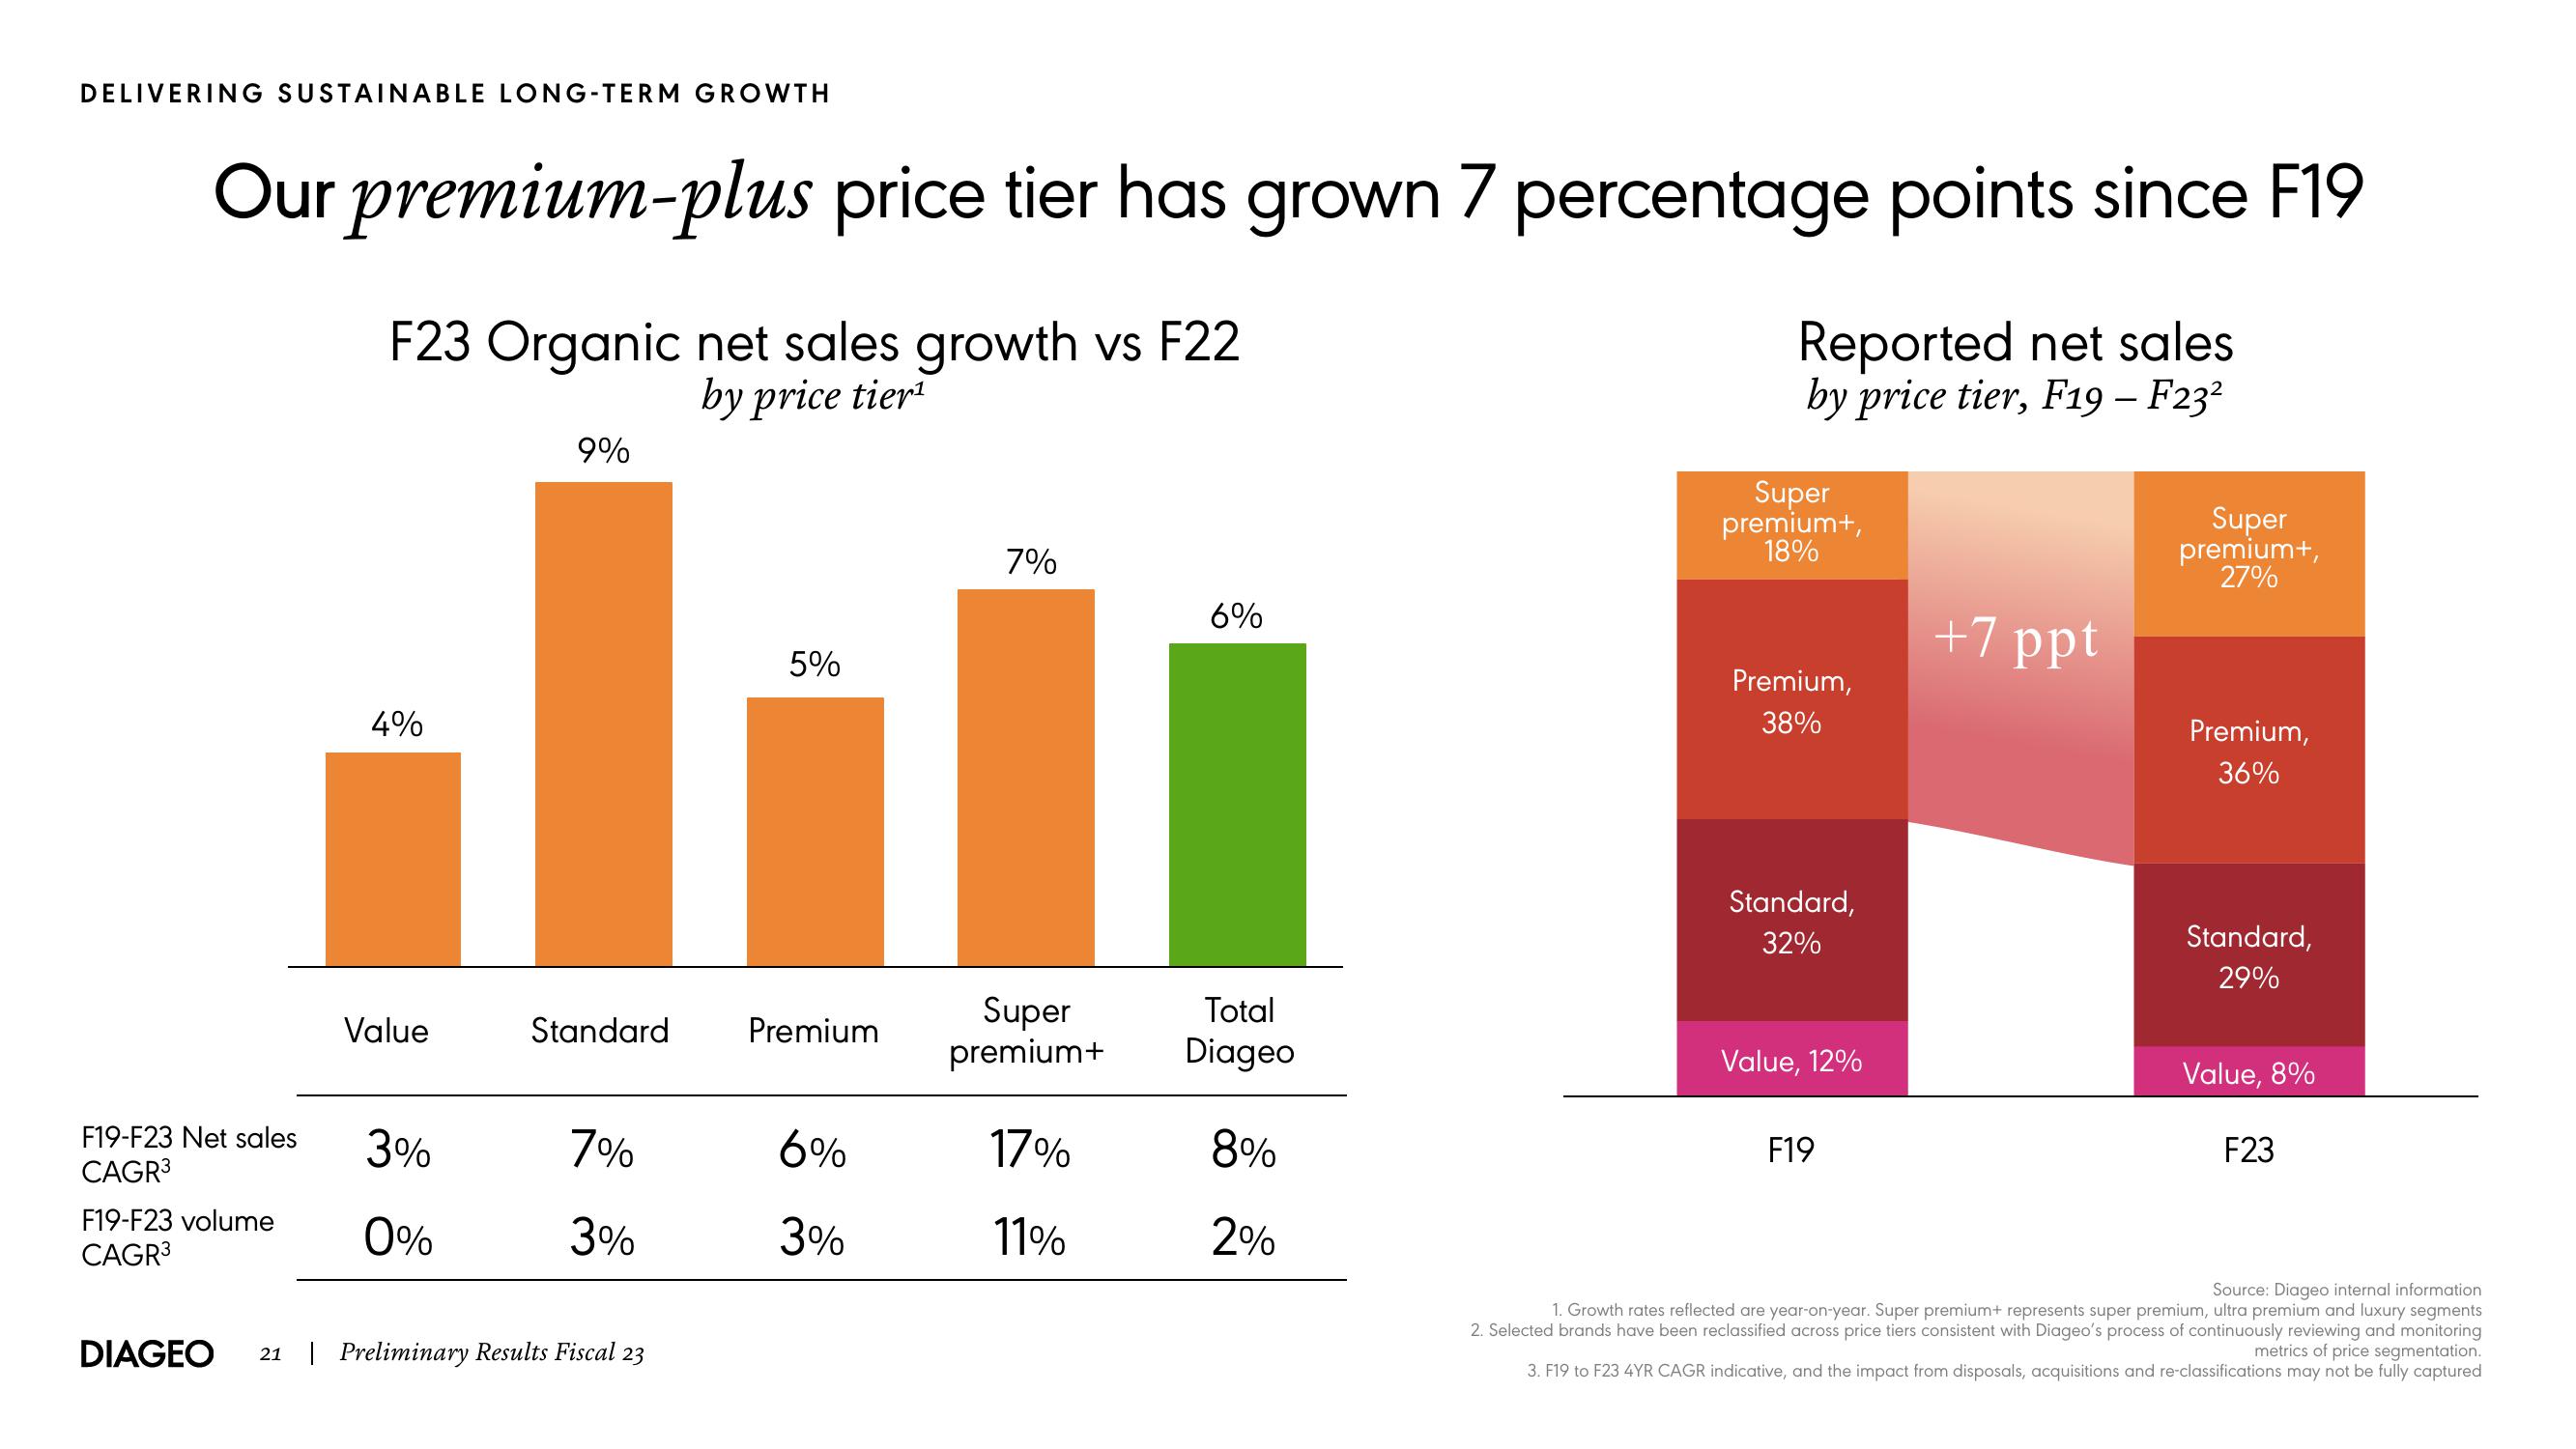
Our premium-plus price tier has grown 7 percentage points since F19
F19-F23 Net sales
CAGR³
F19-F23 volume
CAGR³
F23 Organic net sales growth vs F22
by price tier
4%
Value
3%
0%
9%
Standard
7%
3%
DIAGEO 21 | Preliminary Results Fiscal 23
5%
Premium
6%
3%
7%
6%
Super
Total
premium+ Diageo
17%
11%
8%
2%
Reported net sales
by price tier, F19 - F23²
Super
premium+,
18%
Premium,
38%
Standard,
32%
Value, 12%
F19
+7 ppt
Super
premium+,
27%
Premium,
36%
Standard,
29%
Value, 8%
F23
Source: Diageo internal information
1. Growth rates reflected are year-on-year. Super premium+ represents super premium, ultra premium and luxury segments
2. Selected brands have been reclassified across price tiers consistent with Diageo's process of continuously reviewing and monitoring
metrics of price segmentation.
3. F19 to F23 4YR CAGR indicative, and the impact from disposals, acquisitions and re-classifications may not be fully capturedView entire presentation