Sezzle Results Presentation Deck
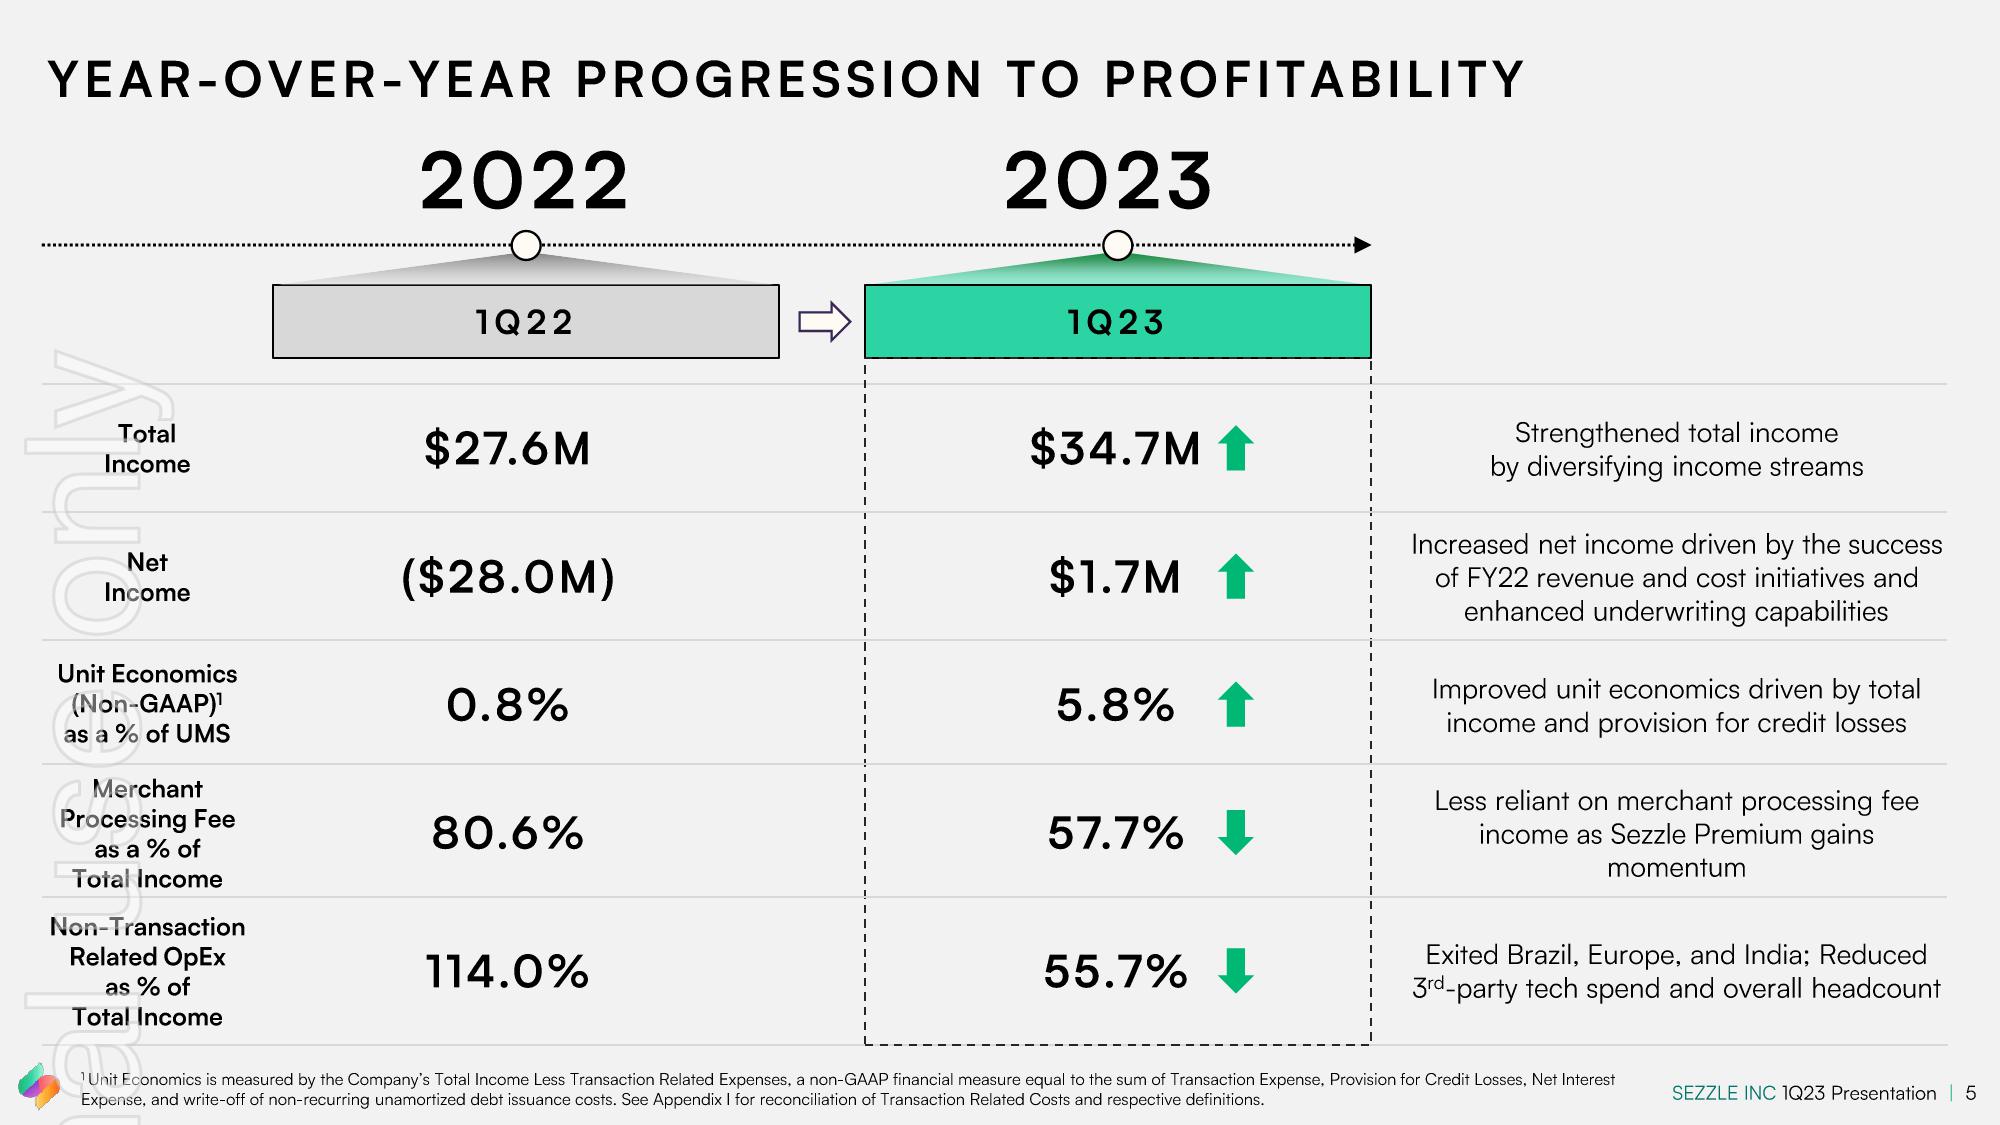
YEAR-OVER-YEAR PROGRESSION
Total
Income
Net
Income
Unit Economics
(Non-GAAP)¹
as a % of UMS
Merchant
Processing Fee
as a % of
Total Income
Non-Transaction
Related OpEx
as % of
Total Income
2022
1Q22
$27.6M
($28.0M)
0.8%
80.6%
114.0%
介
T
TO PROFITABILITY
2023
1Q23
$34.7M 1
$1.7M 1
5.8% 1
57.7%
55.7%
Strengthened total income
by diversifying income streams
Increased net income driven by the success
of FY22 revenue and cost initiatives and
enhanced underwriting capabilities
Improved unit economics driven by total
income and provision for credit losses
Less reliant on merchant processing fee
income as Sezzle Premium gains
momentum
Exited Brazil, Europe, and India; Reduced
3rd-party tech spend and overall headcount
Cum
Unit Economics is measured by the Company's Total Income Less Transaction Related Expenses, a non-GAAP financial measure equal to the sum of Transaction Expense, Provision for Credit Losses, Net Interest
Expense, and write-off of non-recurring unamortized debt issuance costs. See Appendix I for reconciliation of Transaction Related Costs and respective definitions.
SEZZLE INC 1Q23 Presentation | 5View entire presentation