Nestle Results Presentation Deck
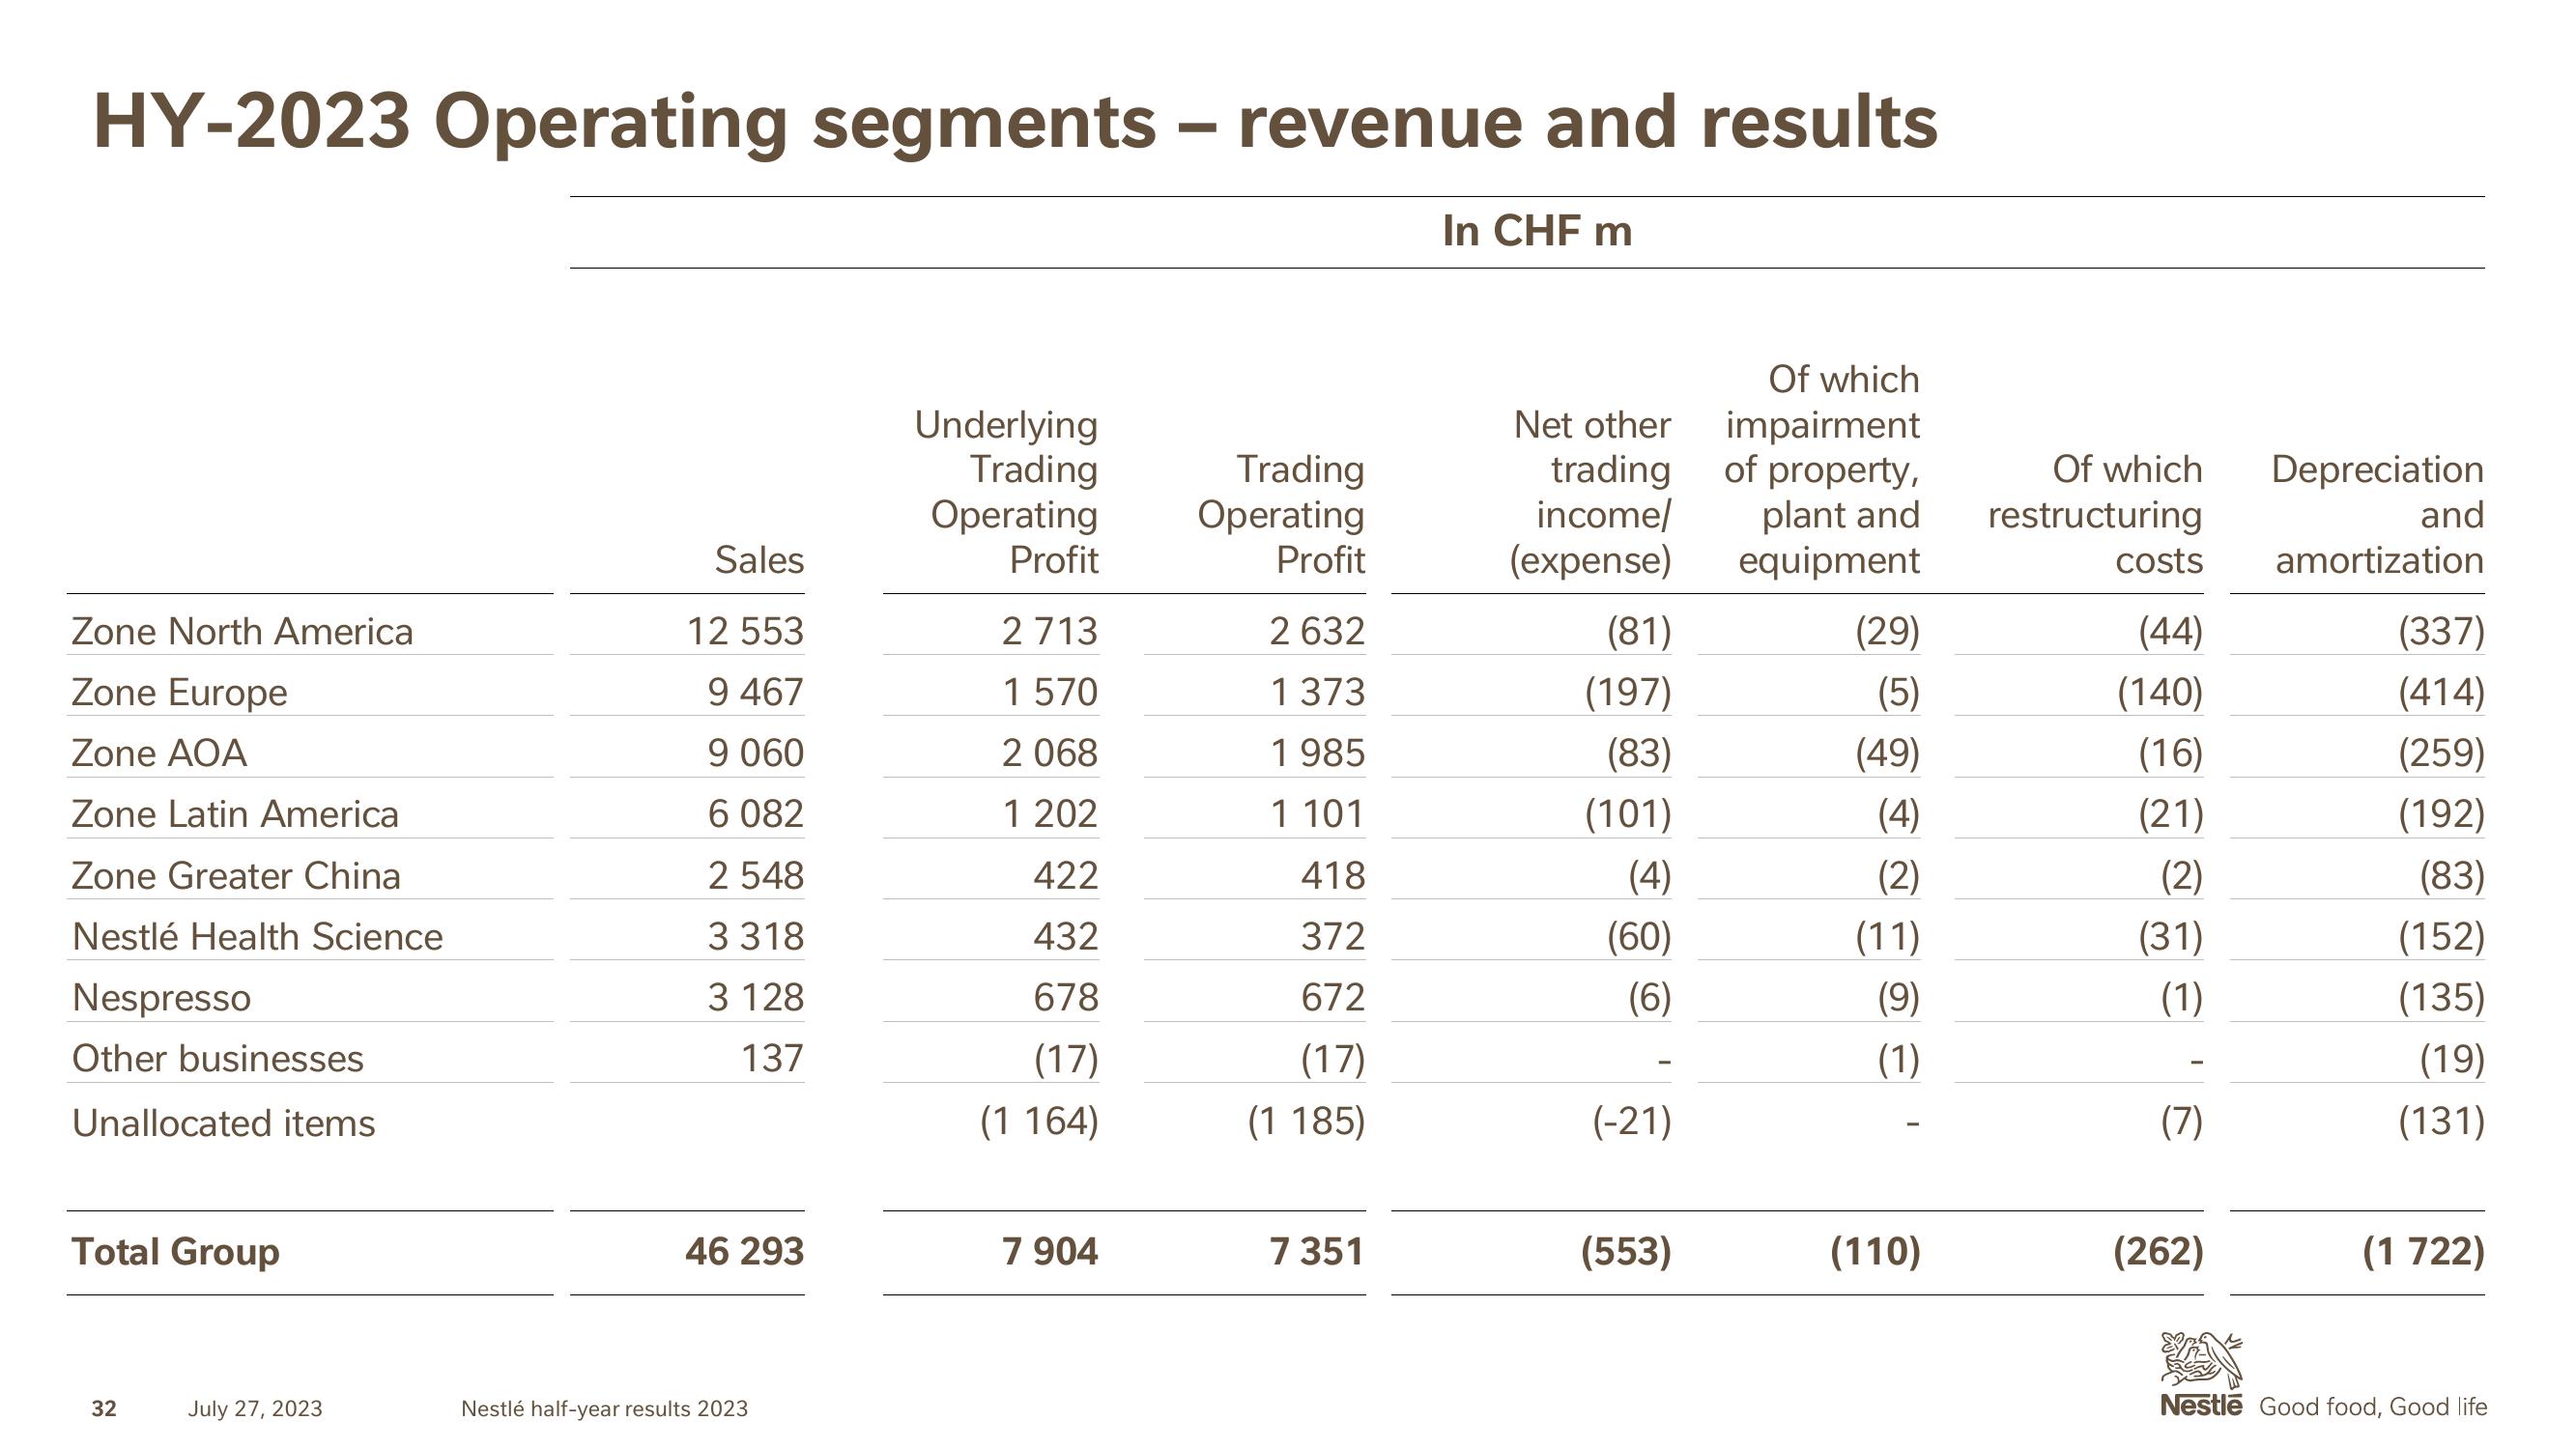
HY-2023 Operating segments - revenue and results
In CHF m
Zone North America
Zone Europe
Zone AOA
Zone Latin America
Zone Greater China
Nestlé Health Science
Nespresso
Other businesses
Unallocated items
Total Group
32
July 27, 2023
Sales
12 553
9 467
9 060
6 082
2 548
3 318
3 128
137
46 293
Nestlé half-year results 2023
Underlying
Trading
Operating
Profit
2713
1 570
2 068
1 202
422
432
678
(17)
(1 164)
7 904
Trading
Operating
Profit
2 632
1 373
1 985
1 101
418
372
672
(17)
(1 185)
7 351
Net other
trading
income/
(expense)
(81)
(197)
(83)
(101)
(4)
(60)
(6)
(-21)
(553)
Of which
impairment
of property,
plant and
equipment
(29)
(5)
(49)
(4)
(2)
(11)
(9)
(1)
(110)
Of which
restructuring
costs
(44)
(140)
(16)
(21)
(2)
(31)
(1)
(7)
(262)
Depreciation
and
amortization
(337)
(414)
(259)
(192)
(83)
(152)
(135)
(19)
(131)
(1 722)
Nestle Good food, Good lifeView entire presentation