DraftKings Investor Day Presentation Deck
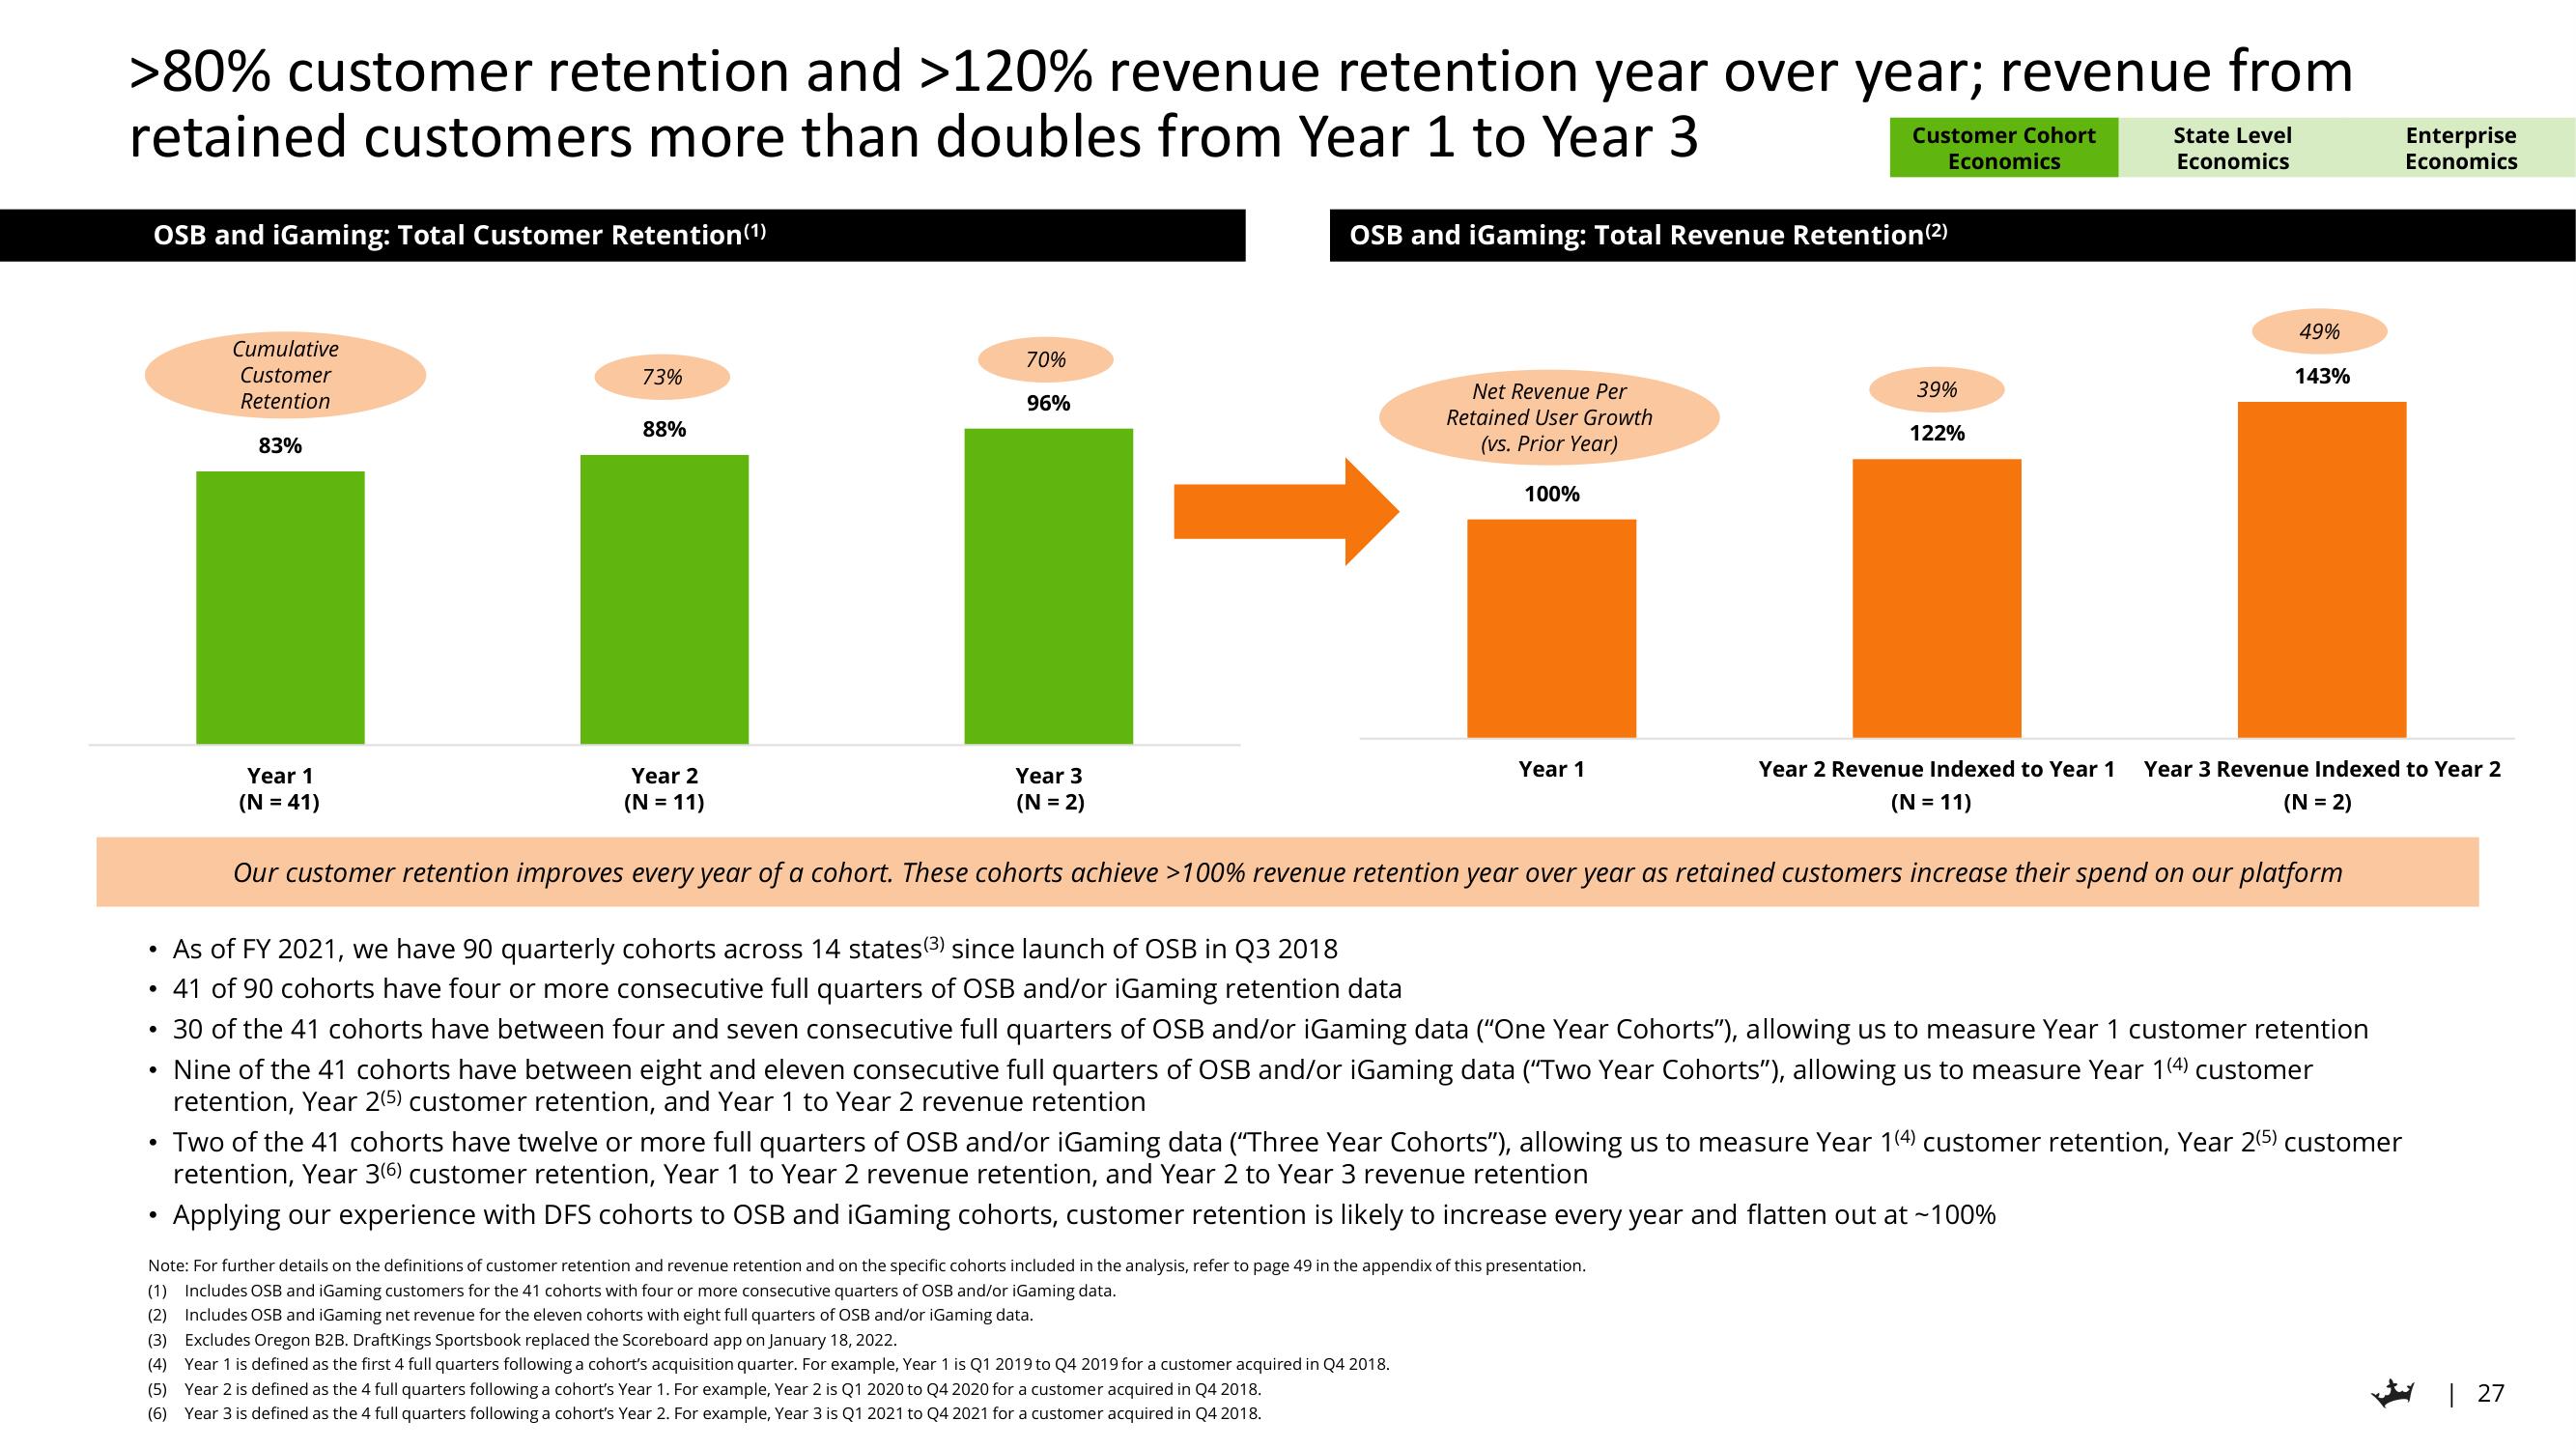
>80% customer retention and >120% revenue retention year over year; revenue from
retained customers more than doubles from Year 1 to Year 3
OSB and iGaming: Total Customer Retention (1)
●
●
●
73%
Cumulative
Customer
Retention
83%
i
Year 1
(N = 41)
Year 2
(N = 11)
Year 3
(N = 2)
Year 2 Revenue Indexed to Year 1 Year 3 Revenue Indexed to Year 2
(N = 11)
(N = 2)
Our customer retention improves every year of a cohort. These cohorts achieve > 100% revenue retention year over year as retained customers increase their spend on our platform
As of FY 2021, we have 90 quarterly cohorts across 14 states (3) since launch of OSB in Q3 2018
41 of 90 cohorts have four or more consecutive full quarters of OSB and/or iGaming retention data
• 30 of the 41 cohorts have between four and seven consecutive full quarters of OSB and/or iGaming data ("One Year Cohorts"), allowing us to measure Year 1 customer retention
Nine of the 41 cohorts have between eight and eleven consecutive full quarters of OSB and/or iGaming data ("Two Year Cohorts"), allowing us to measure Year 1(4) customer
retention, Year 2(5) customer retention, and Year 1 to Year 2 revenue retention
●
88%
70%
96%
OSB and iGaming: Total Revenue Retention (²)
Net Revenue Per
Retained User Growth
(vs. Prior Year)
100%
(3) Excludes Oregon B2B. DraftKings Sportsbook replaced the Scoreboard app on January 18, 2022.
(4) Year 1 is defined as the first 4 full quarters following a cohort's acquisition quarter. For example, Year 1 is Q1 2019 to Q4 2019 for a customer acquired in Q4 2018.
(5) Year 2 is defined as the 4 full quarters following a cohort's Year 1. For example, Year 2 is Q1 2020 to Q4 2020 for a customer acquired in Q4 2018.
(6) Year 3 is defined as the 4 full quarters following a cohort's Year 2. For example, Year 3 is Q1 2021 to Q4 2021 for a customer acquired in Q4 2018.
Customer Cohort
Economics
Year 1
Note: For further details on the definitions of customer retention and revenue retention and on the specific cohorts included in the analysis, refer to page 49 in the appendix of this presentation.
(1) Includes OSB and iGaming customers for the 41 cohorts with four or more consecutive quarters of OSB and/or iGaming data.
(2) Includes OSB and iGaming net revenue for the eleven cohorts with eight full quarters of OSB and/or iGaming data.
State Level
Economics
39%
122%
Two of the 41 cohorts have twelve or more full quarters of OSB and/or iGaming data ("Three Year Cohorts"), allowing us to measure Year 1(4) customer retention, Year 2(5) customer
retention, Year 3(6) customer retention, Year 1 to Year 2 revenue retention, and Year 2 to Year 3 revenue retention
• Applying our experience with DFS cohorts to OSB and iGaming cohorts, customer retention is likely to increase every year and flatten out at ~100%
49%
143%
Enterprise
Economics
| 27View entire presentation