Paysafe Results Presentation Deck
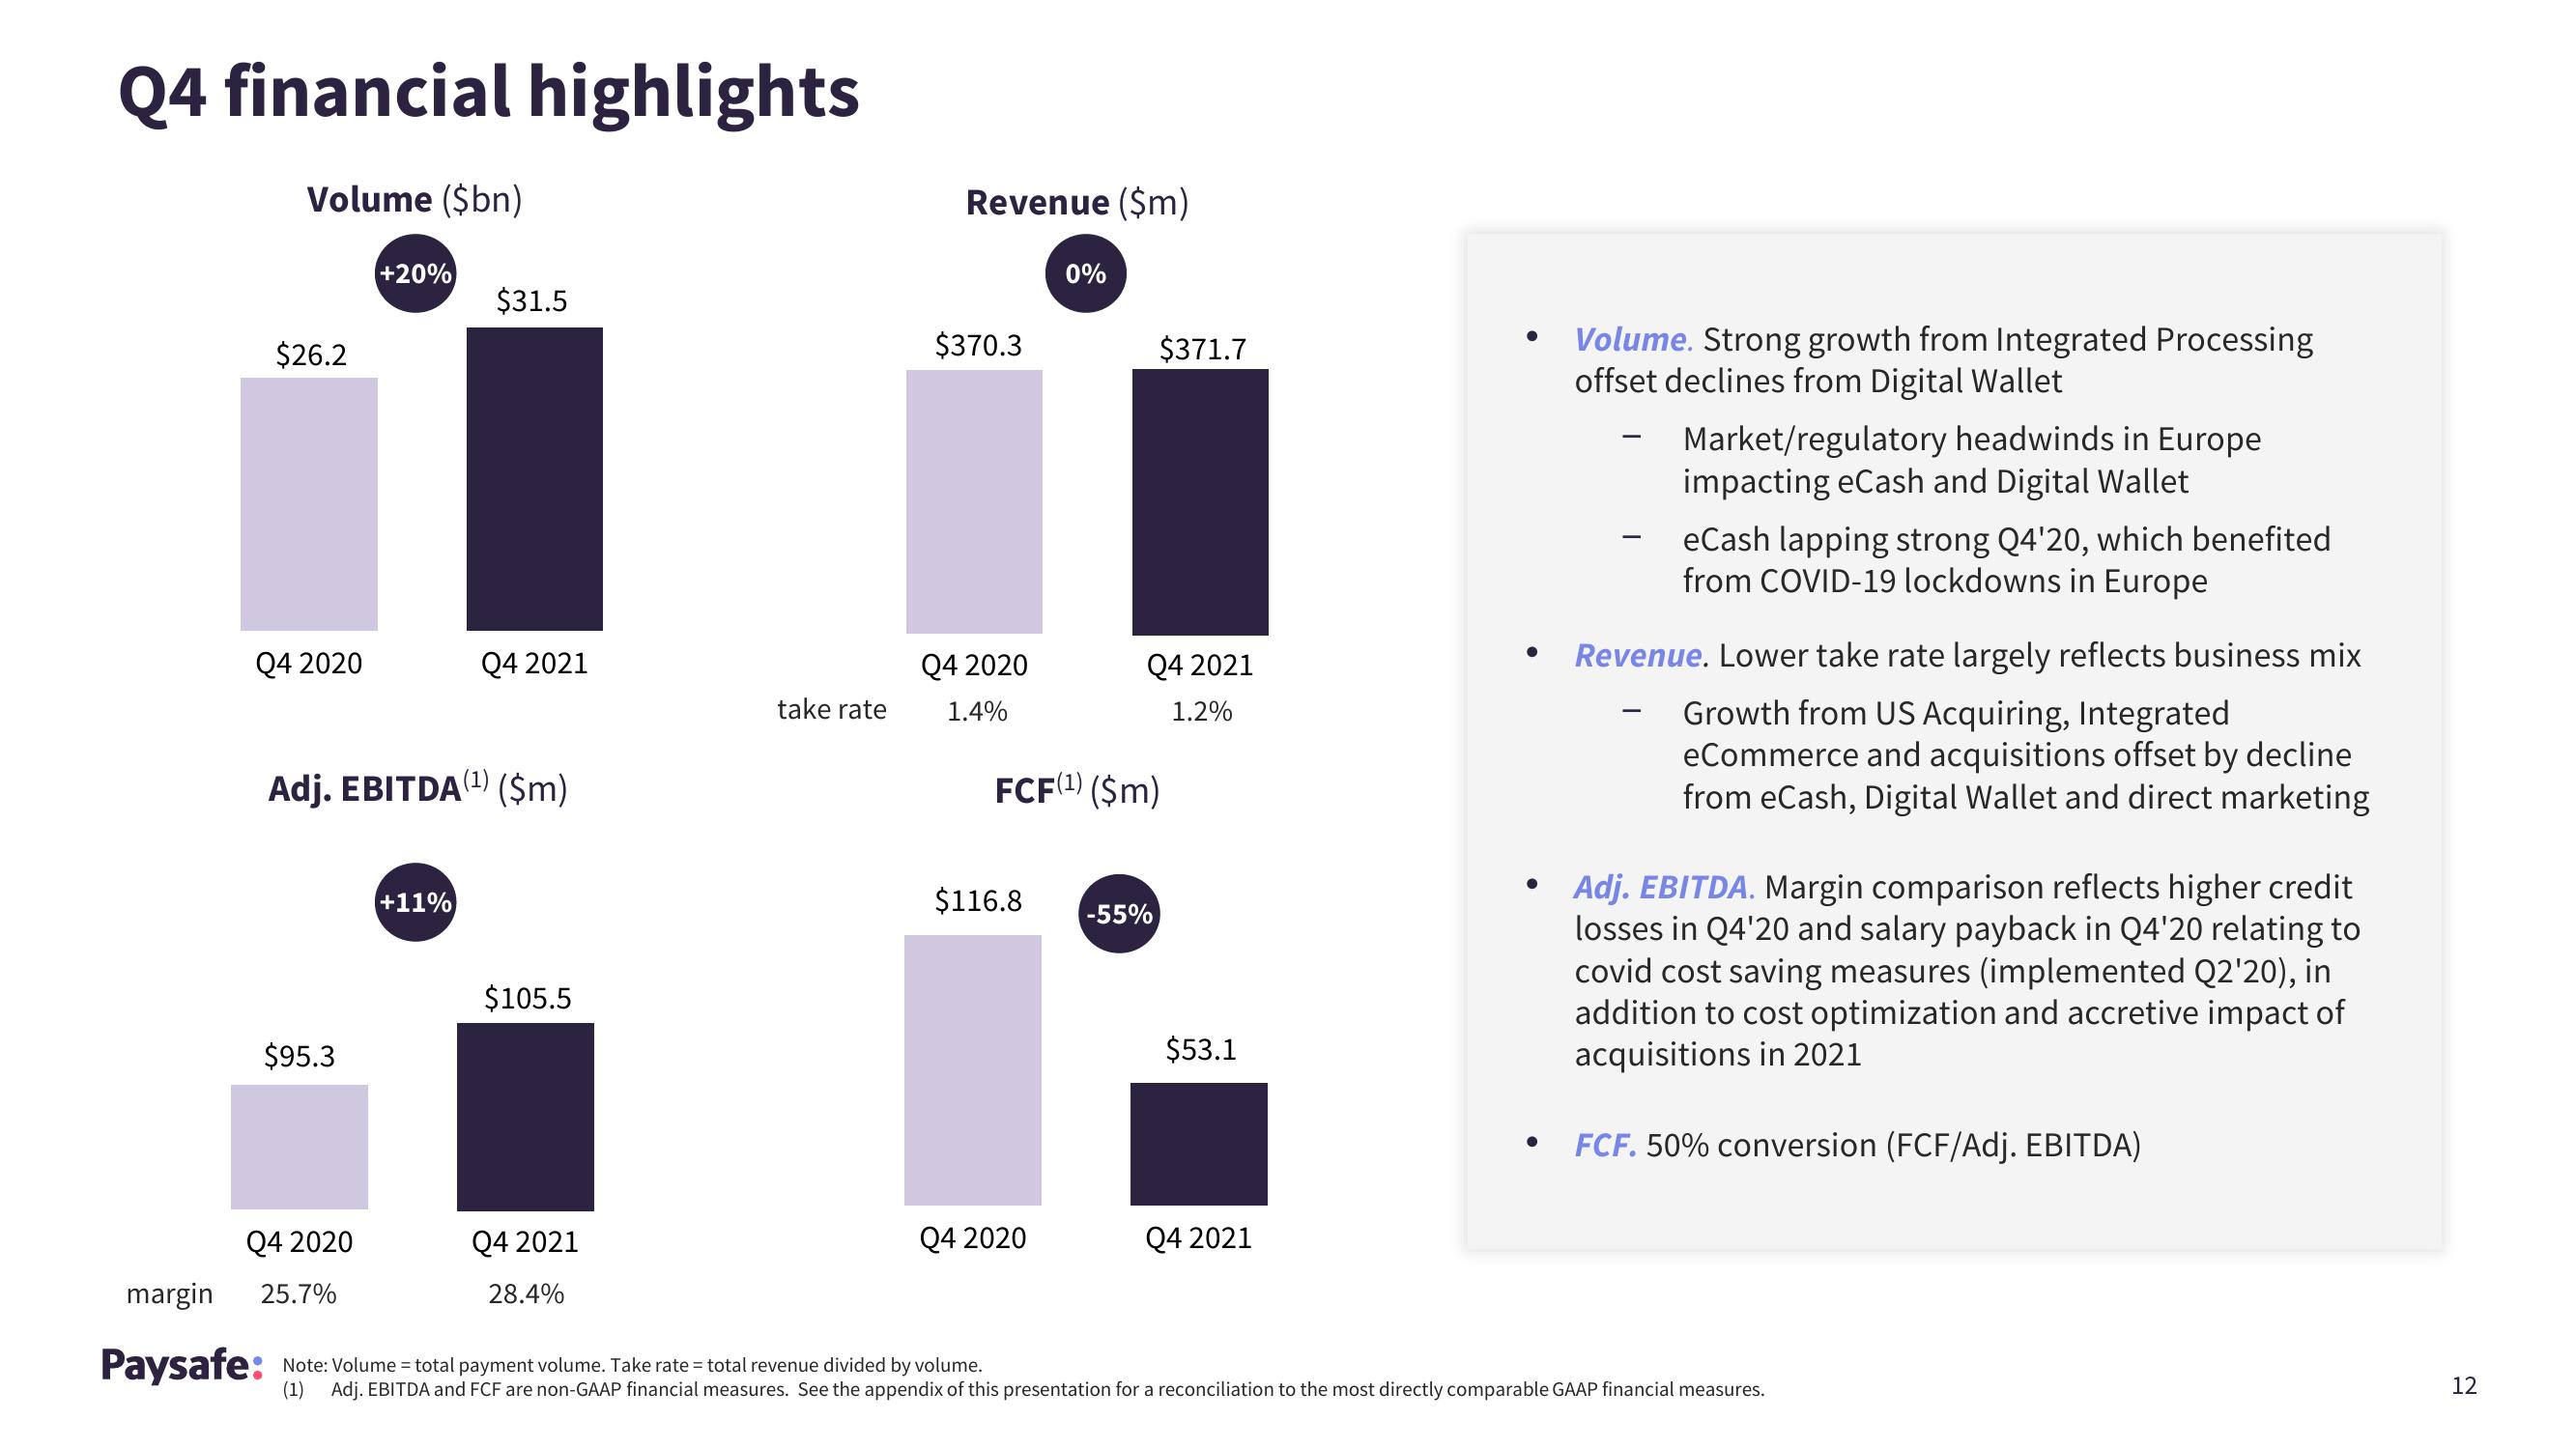
Q4 financial highlights
Volume ($bn)
$26.2
Q4 2020
$95.3
Q4 2020
+20%
Adj. EBITDA (¹) ($m)
margin 25.7%
$31.5
+11%
Q4 2021
$105.5
Q4 2021
28.4%
take rate
Revenue ($m)
$370.3
Q4 2020
1.4%
$116.8
Q4 2020
Paysafe: Note: Volume = total payment volume. Take rate = total revenue divided by volume.
0%
FCF(¹) ($m)
$371.7
Q4 2021
1.2%
-55%
$53.1
Q4 2021
●
●
●
Volume. Strong growth from Integrated Processing
offset declines from Digital Wallet
Market/regulatory headwinds in Europe
impacting eCash and Digital Wallet
eCash lapping strong Q4'20, which benefited
from COVID-19 lockdowns in Europe
Revenue. Lower take rate largely reflects business mix
Growth from US Acquiring, Integrated
eCommerce and acquisitions offset by decline
from eCash, Digital Wallet and direct marketing
Adj. EBITDA. Margin comparison reflects higher credit
losses in Q4'20 and salary payback in Q4'20 relating to
covid cost saving measures (implemented Q2'20), in
addition to cost optimization and accretive impact of
acquisitions in 2021
FCF. 50% conversion (FCF/Adj. EBITDA)
(1) Adj. EBITDA and FCF are non-GAAP financial measures. See the appendix of this presentation for a reconciliation to the most directly comparable GAAP financial measures.
12View entire presentation