Paysafe Results Presentation Deck
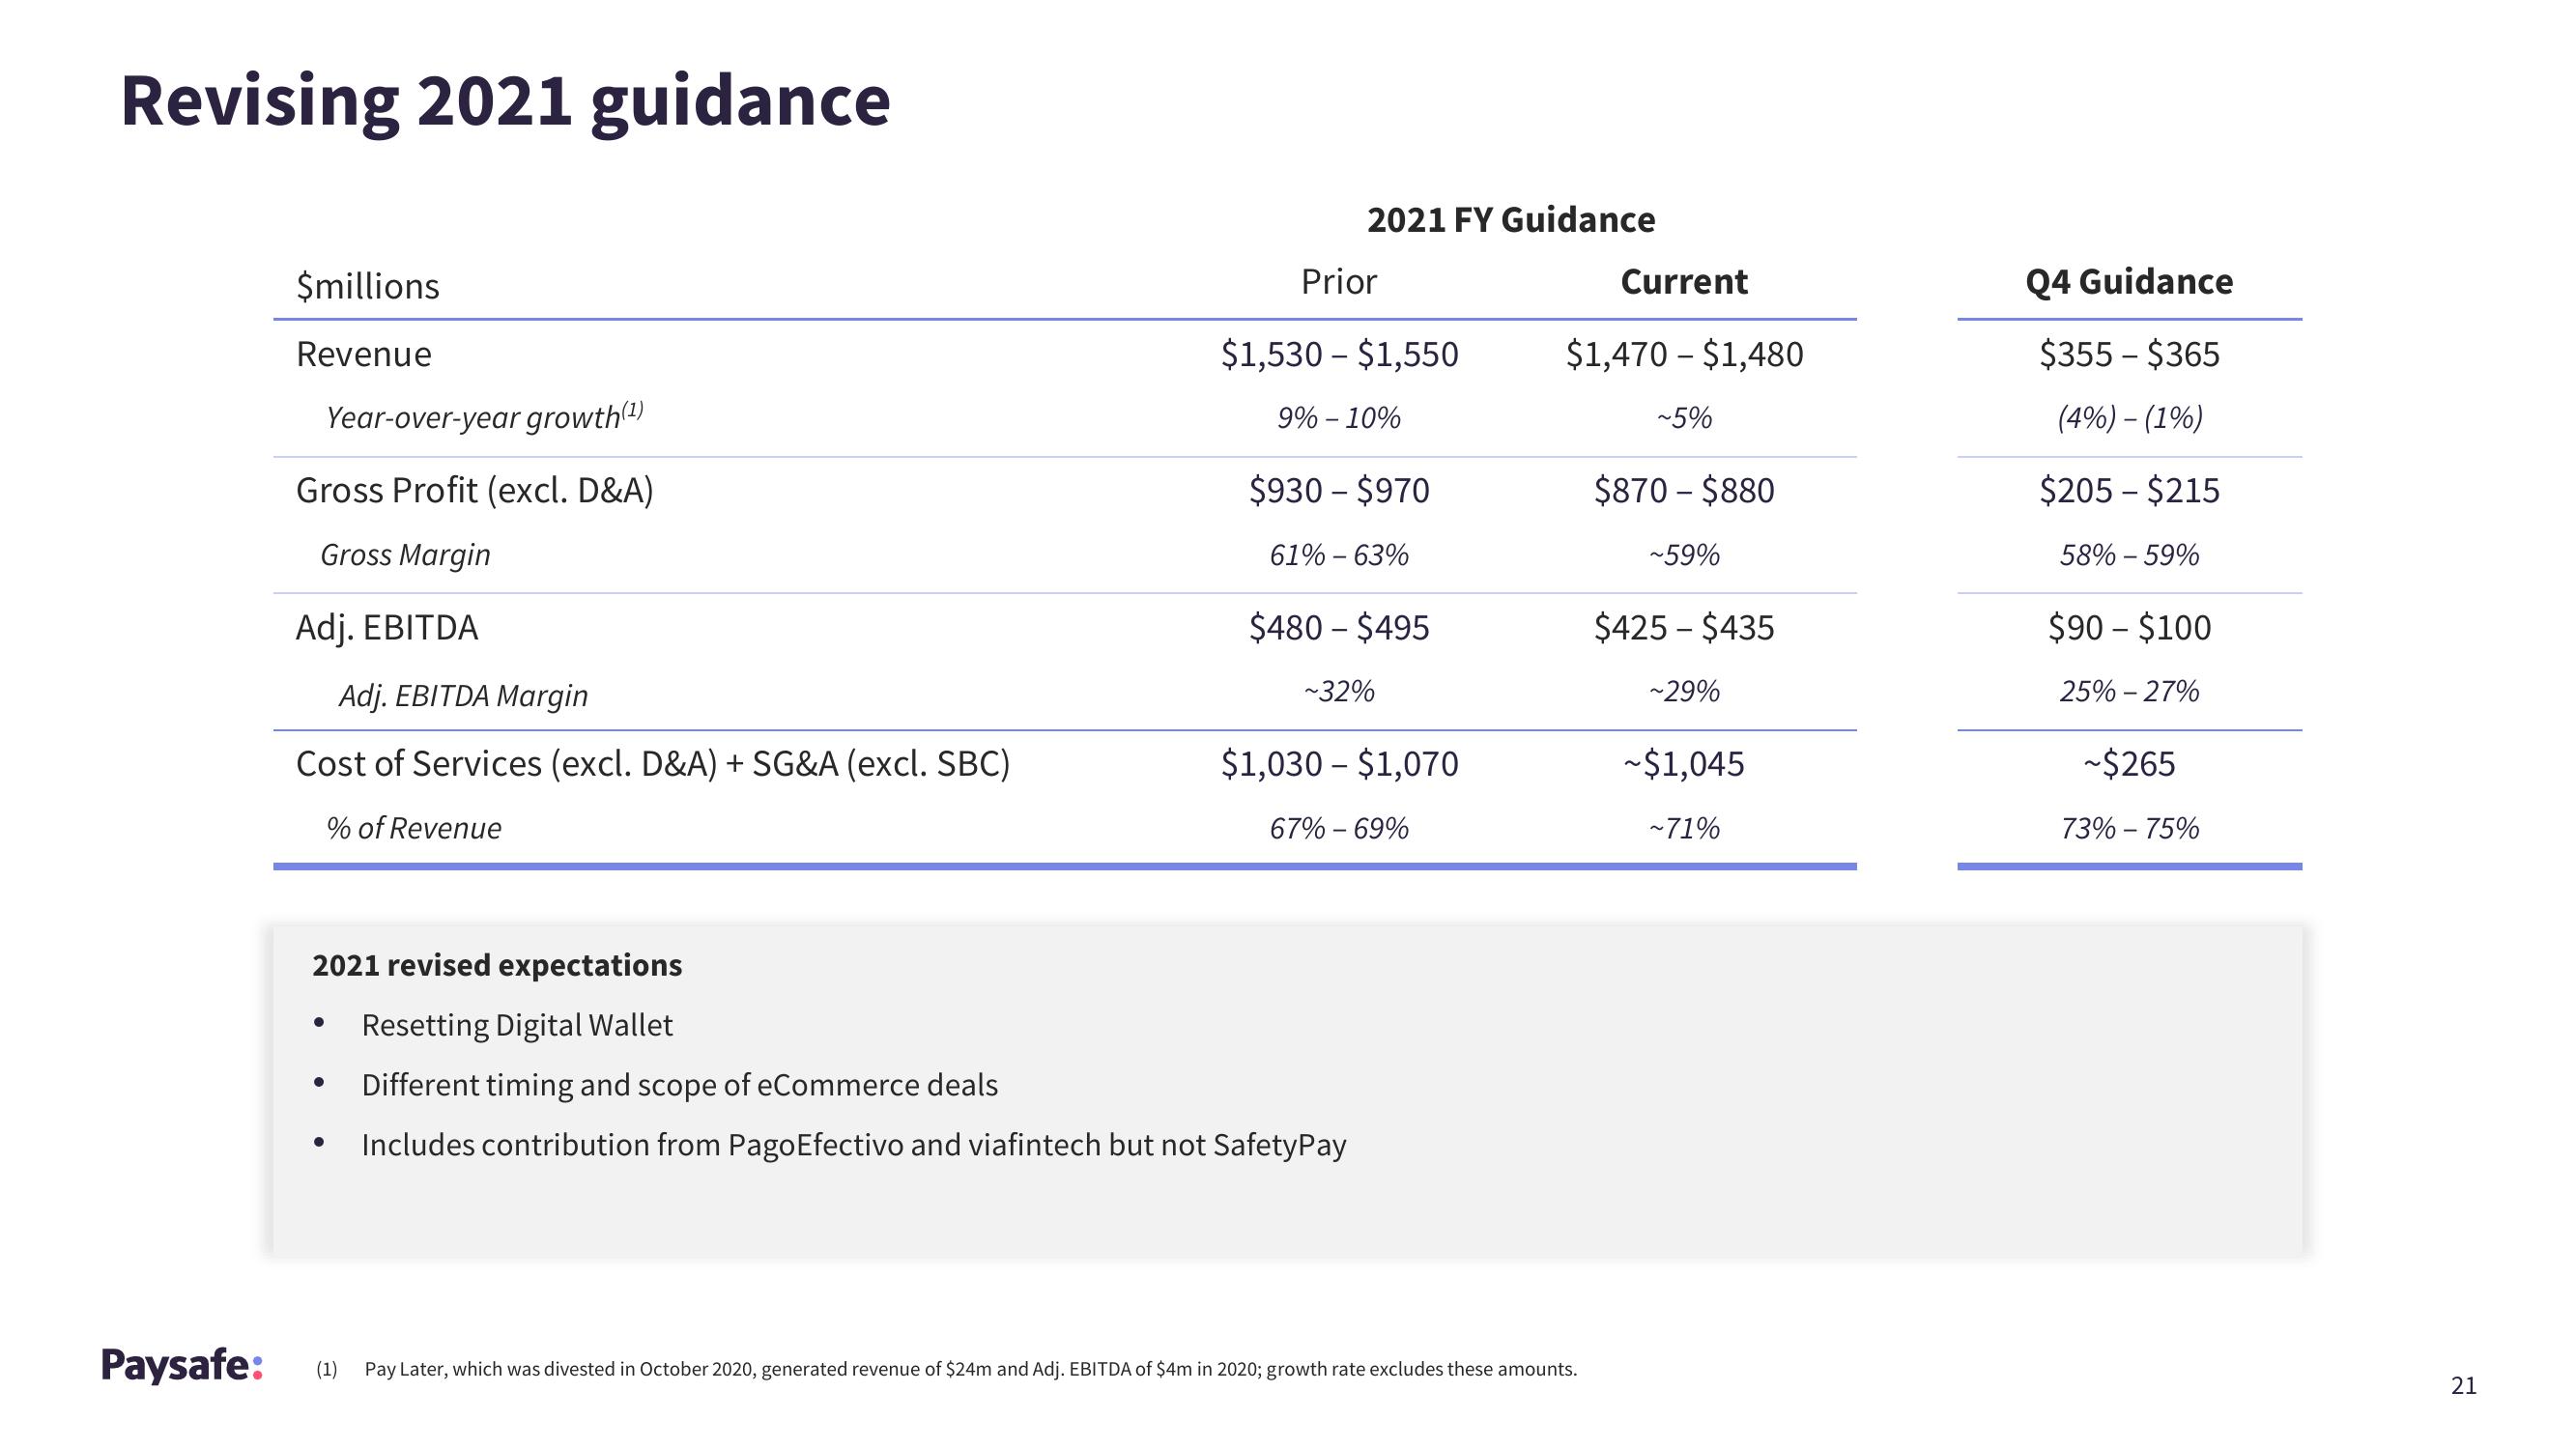
Revising 2021 guidance
Paysafe:
$millions
Revenue
Year-over-year growth(¹)
Gross Profit (excl. D&A)
Gross Margin
Adj. EBITDA
Adj. EBITDA Margin
Cost of Services (excl. D&A) + SG&A (excl. SBC)
% of Revenue
●
●
2021 FY Guidance
Prior
$1,530 - $1,550
9% - 10%
$930 - $970
61% -63%
$480 - $495
~32%
2021 revised expectations
Resetting Digital Wallet
Different timing and scope of eCommerce deals
Includes contribution from PagoEfectivo and viafintech but not SafetyPay
$1,030 $1,070
67% -69%
Current
$1,470 - $1,480
~5%
(1) Pay Later, which was divested in October 2020, generated revenue of $24m and Adj. EBITDA of $4m in 2020; growth rate excludes these amounts.
$870 - $880
~59%
$425 - $435
~29%
~$1,045
~71%
Q4 Guidance
$355 - $365
(4%) - (1%)
$205 - $215
58% -59%
$90 - $100
25% -27%
~$265
73% -75%
21View entire presentation