Zegna Results Presentation Deck
1H 2022 GROUP REVENUES BY GEOGRAPHY
●
(Euro thousands in Actual FX)
Revenues
1
EMEA
- of which Italy
- of which UK
North America ²
- of which United States
Latin America
APAC 4
- of which Greater China Region
- of which Japan
6
Other
●
5
1Q 2022
377,579
134,456
64,091
10,970
61,803
June 2022 rebound in GCR
56,933
5,665
174,816
141,980
14,139
839
1Q 2021
301,194
96,812
48,159
5,177
33,381
28,868
2,995
167,259
141,570
12,812
747
A% vs 1Q 2021
+25.4%
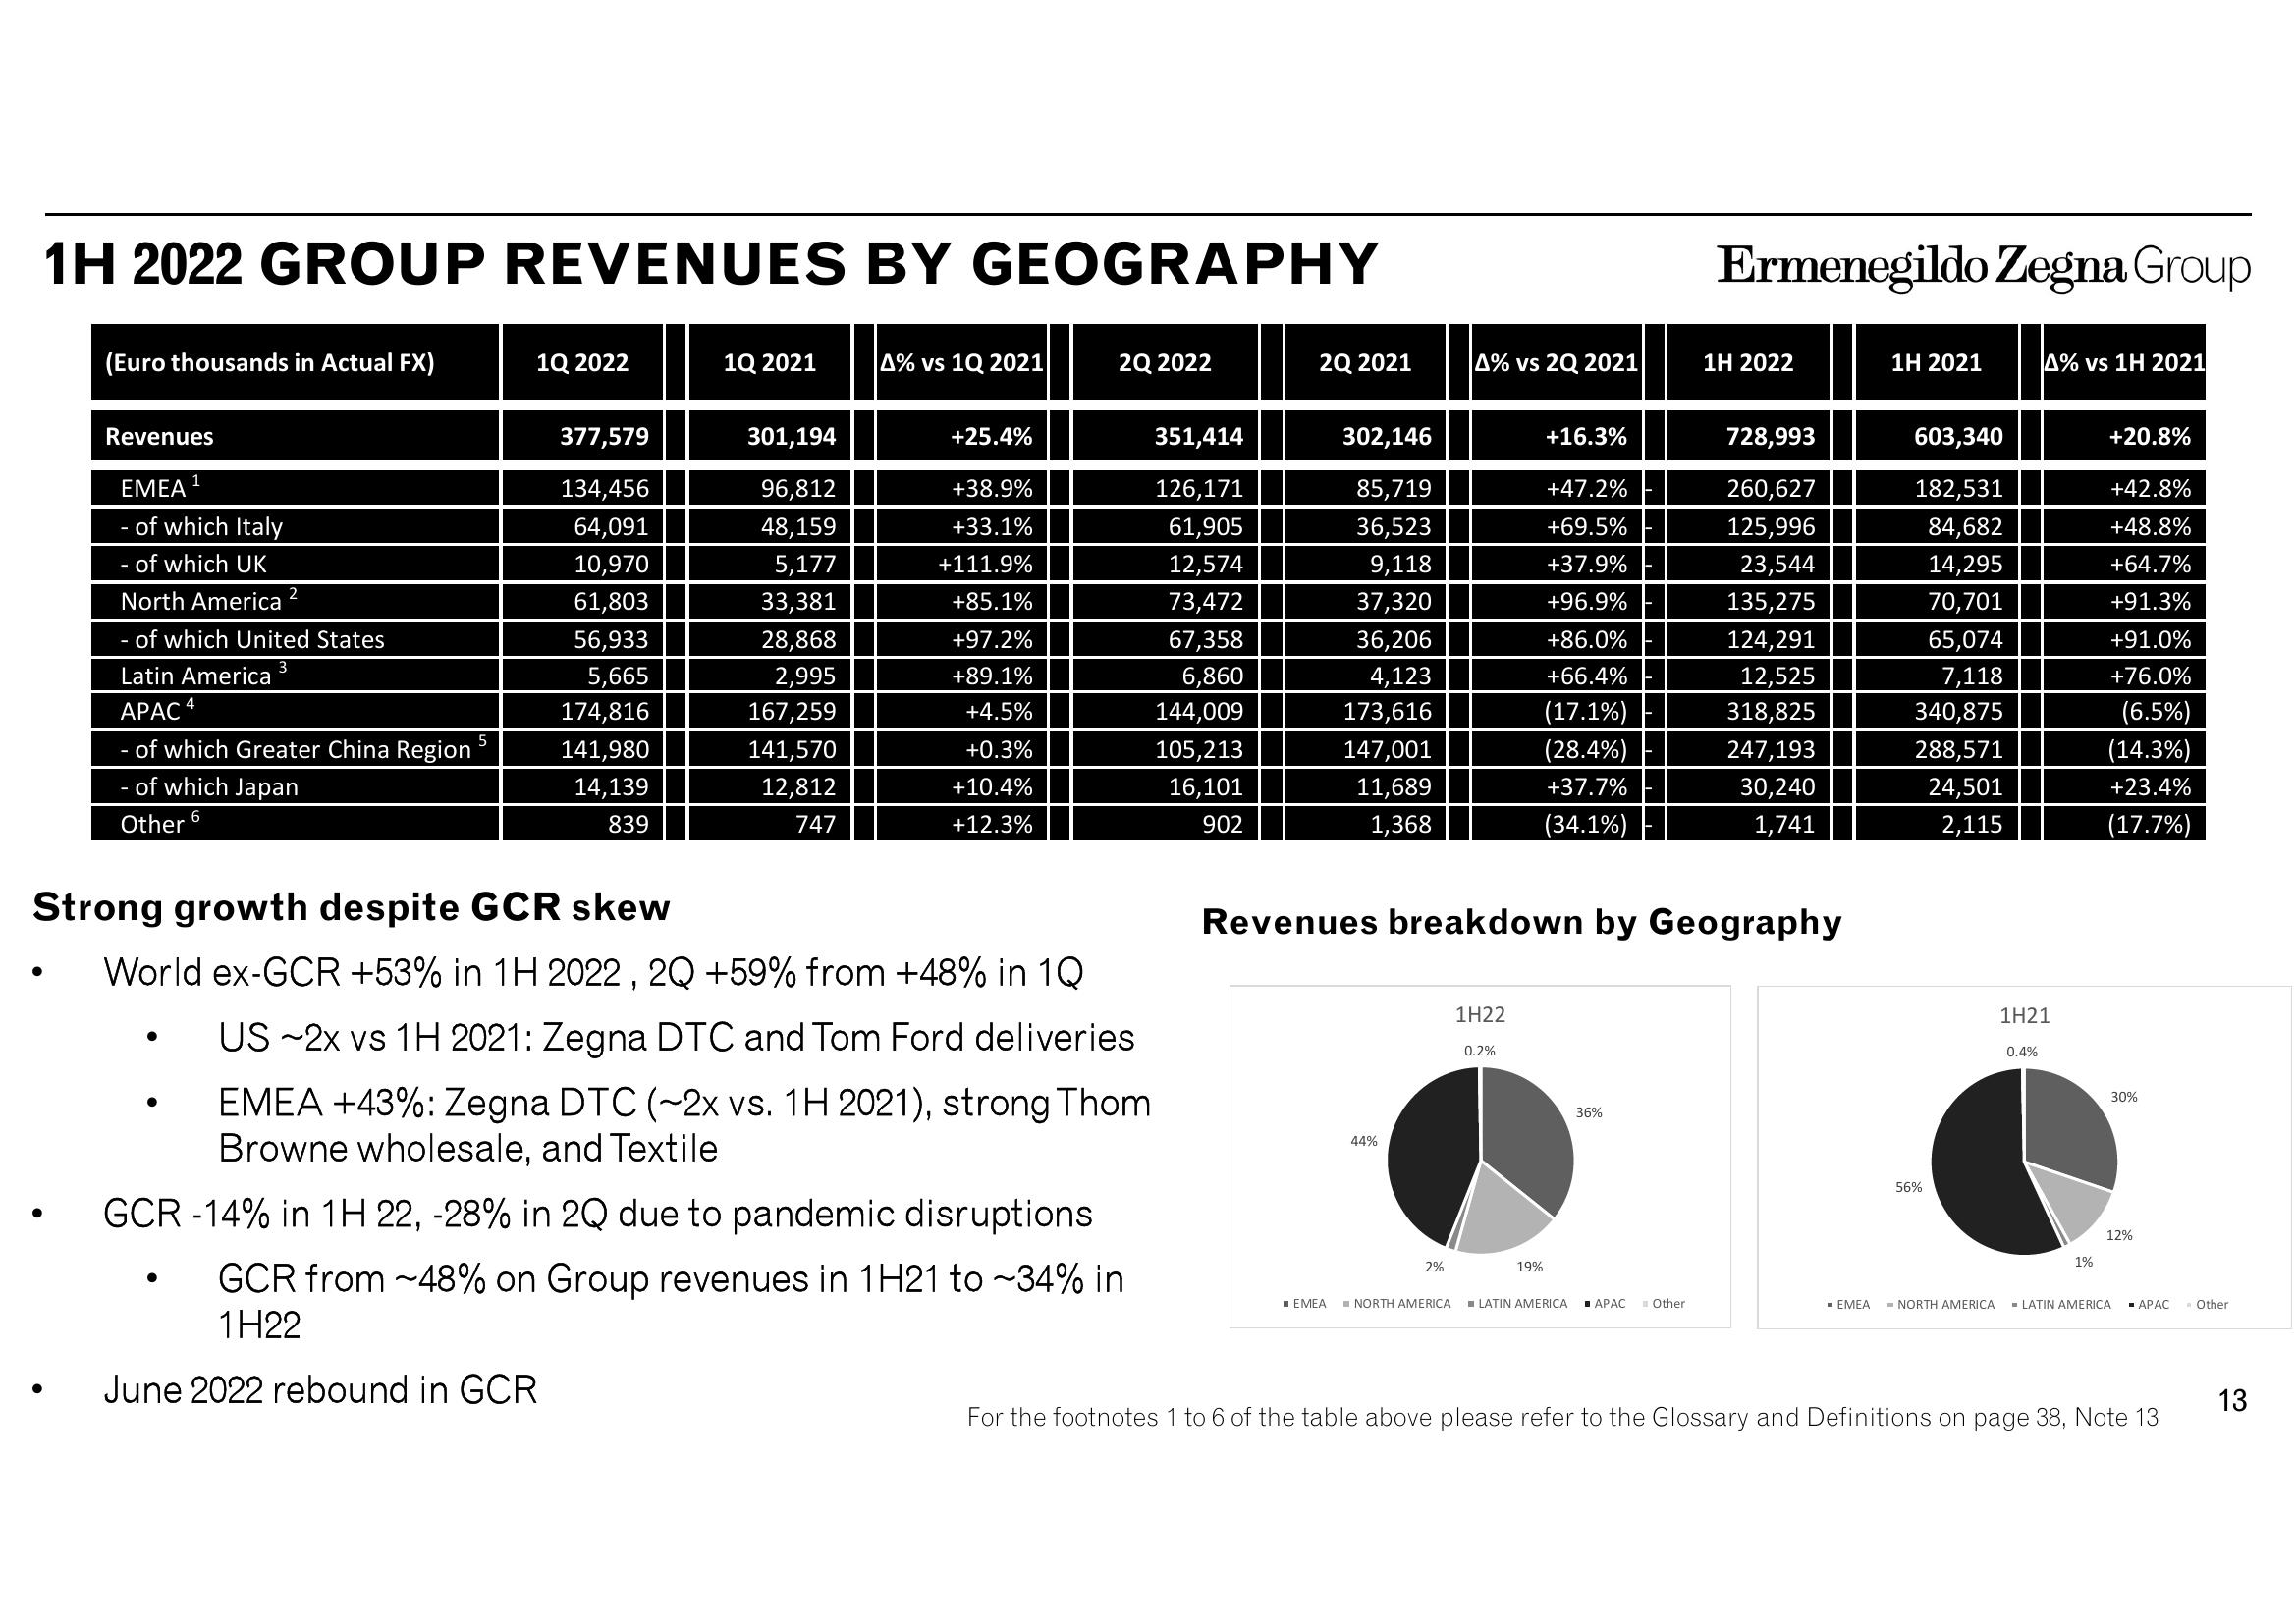
Strong growth despite GCR skew
World ex-GCR +53% in 1H 2022, 2Q +59% from +48% in 1Q
US-2x vs 1H 2021: Zegna DTC and Tom Ford deliveries
EMEA +43%: Zegna DTC (~2x vs. 1H 2021), strong Thom
Browne wholesale, and Textile
GCR -14% in 1H 22, -28% in 2Q due to pandemic disruptions
GCR from ~48% on Group revenues in 1H21 to ~34% in
1H22
+38.9%
+33.1%
+111.9%
+85.1%
+97.2%
+89.1%
+4.5%
+0.3%
+10.4%
+12.3%
2Q 2022
351,414
126,171
61,905
12,574
73,472
67,358
6,860
144,009
105,213
16,101
902
2Q 2021
302,146
85,719
36,523
9,118
37,320
36,206
4,123
173,616
147,001
11,689
1,368
44%
2%
A% vs 2Q 2021
☐ EMEA NORTH AMERICA
1H22
Revenues breakdown by Geography
0.2%
+16.3%
19%
+47.2%
+69.5%
+37.9%
+96.9%
+86.0%
+66.4%
(17.1%)
(28.4%)
+37.7%
(34.1%)
36%
Ermenegildo Zegna Group
LATIN AMERICA ■APAC Other
1H 2022
728,993
260,627
125,996
23,544
135,275
124,291
12,525
318,825
247,193
30,240
1,741
- EMEA
1H 2021
603,340
182,531
84,682
14,295
70,701
65,074
7,118
340,875
288,571
24,501
2,115
56%
A% vs 1H 2021
1H21
0.4%
1%
+20.8%
+42.8%
+48.8%
+64.7%
+91.3%
+91.0%
+76.0%
(6.5%)
(14.3%)
+23.4%
(17.7%)
30%
12%
- NORTH AMERICA - LATIN AMERICA ▪ APAC
For the footnotes 1 to 6 of the table above please refer to the Glossary and Definitions on page 38, Note 13
Other
13View entire presentation