Ginkgo Results Presentation Deck
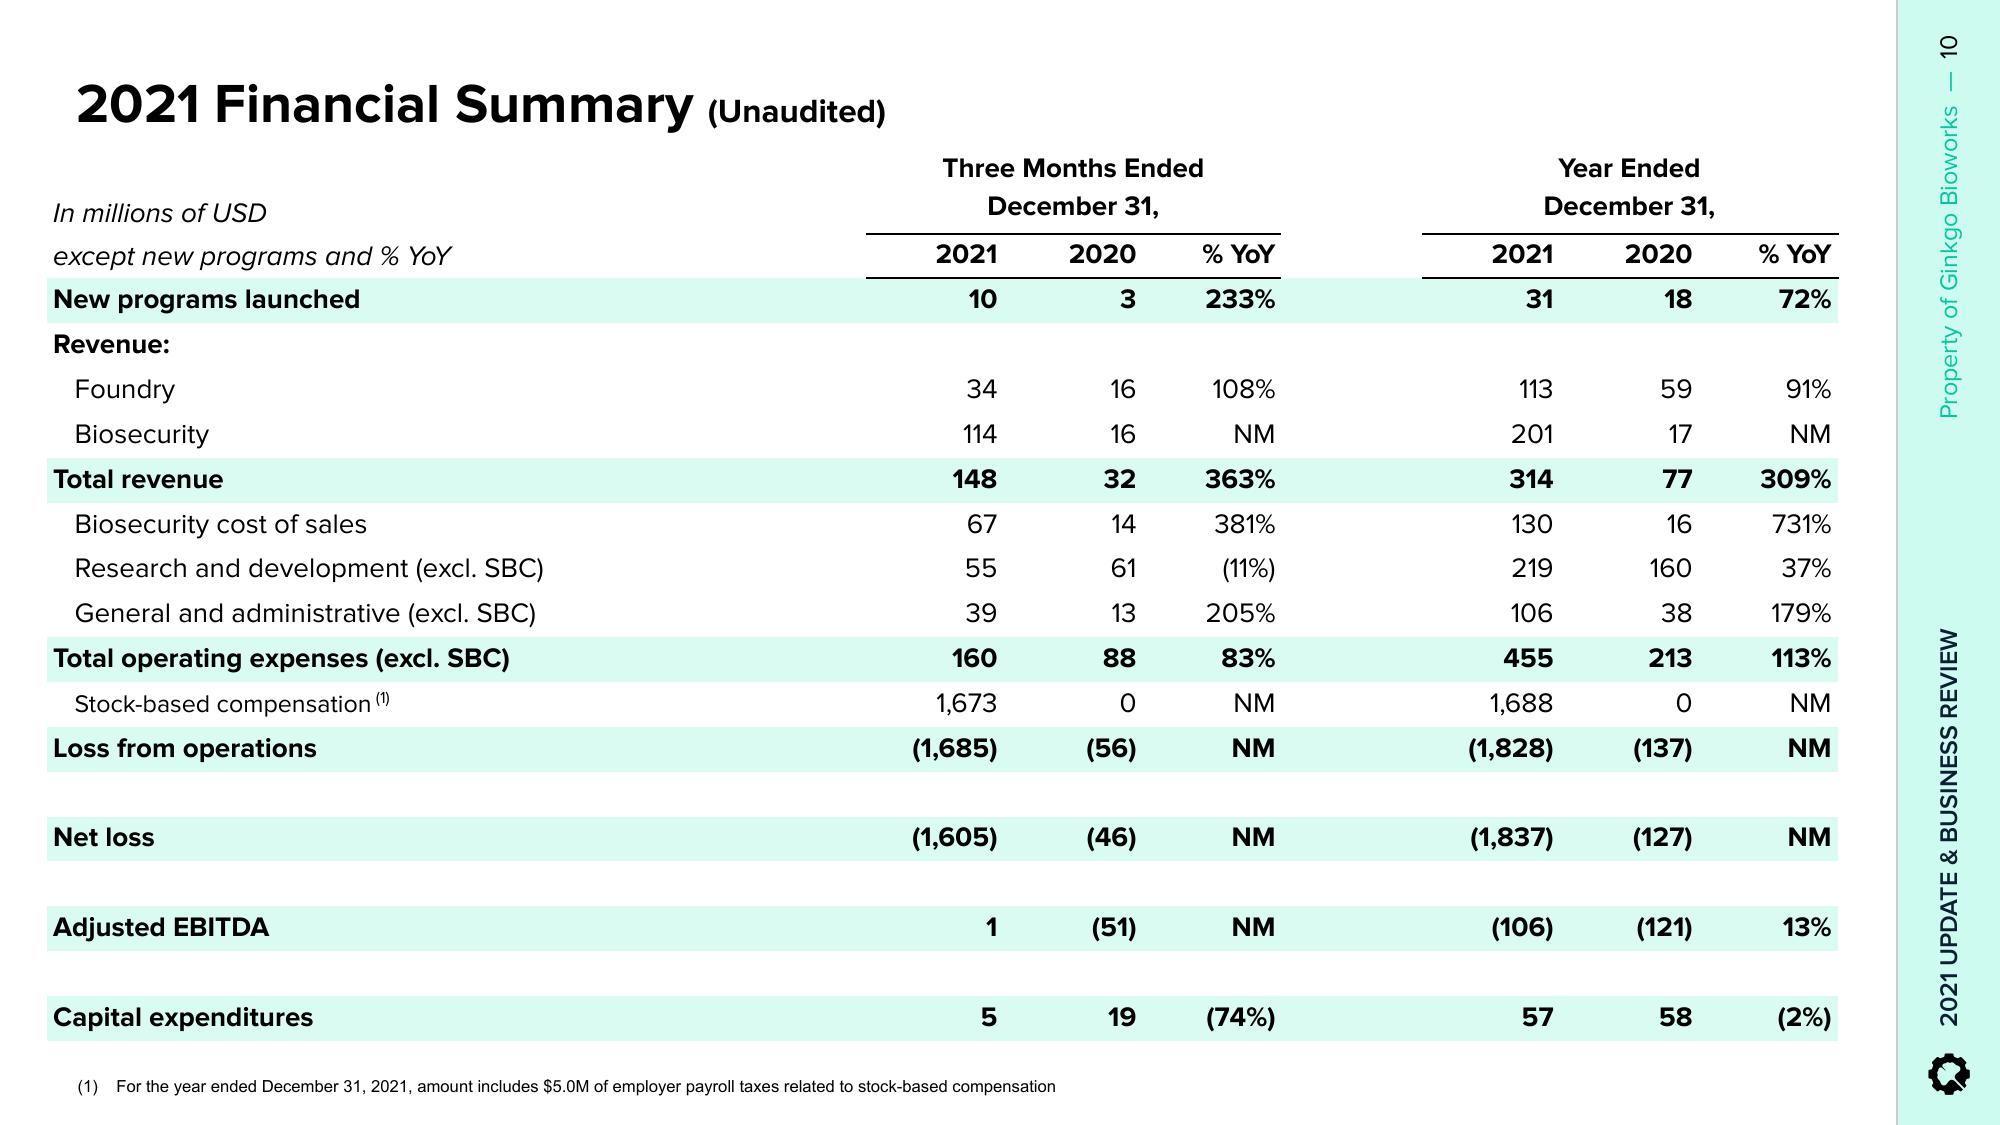
2021 Financial Summary (Unaudited)
In millions of USD
except new programs and % YoY
New programs launched
Revenue:
Foundry
Biosecurity
Total revenue
Biosecurity cost of sales
Research and development (excl. SBC)
General and administrative (excl. SBC)
Total operating expenses (excl. SBC)
Stock-based compensation (1)
Loss from operations
Net loss
Adjusted EBITDA
Capital expenditures
Three Months Ended
December 31,
2021
10
34
114
148
67
55
39
160
1,673
(1,685)
(1,605)
1
5
(1) For the year ended December 31, 2021, amount includes $5.0M of employer payroll taxes related to stock-based compensation
2020
3
16
16
32
14
61
13
88
。
O
(56)
(46)
(51)
19
% YoY
233%
108%
NM
363%
381%
(11%)
205%
83%
NM
NM
NM
NM
(74%)
Year Ended
December 31,
2021
31
113
201
314
130
219
106
455
1,688
(1,828)
(1,837)
(106)
57
2020
18
59
17
77
16
160
38
213
O
(137)
(127)
(121)
58
% YoY
72%
91%
NM
309%
731%
37%
179%
113%
NM
NM
NM
13%
(2%)
10
Property of Ginkgo Bioworks
2021 UPDATE & BUSINESS REVIEWView entire presentation