EVBox SPAC Presentation Deck
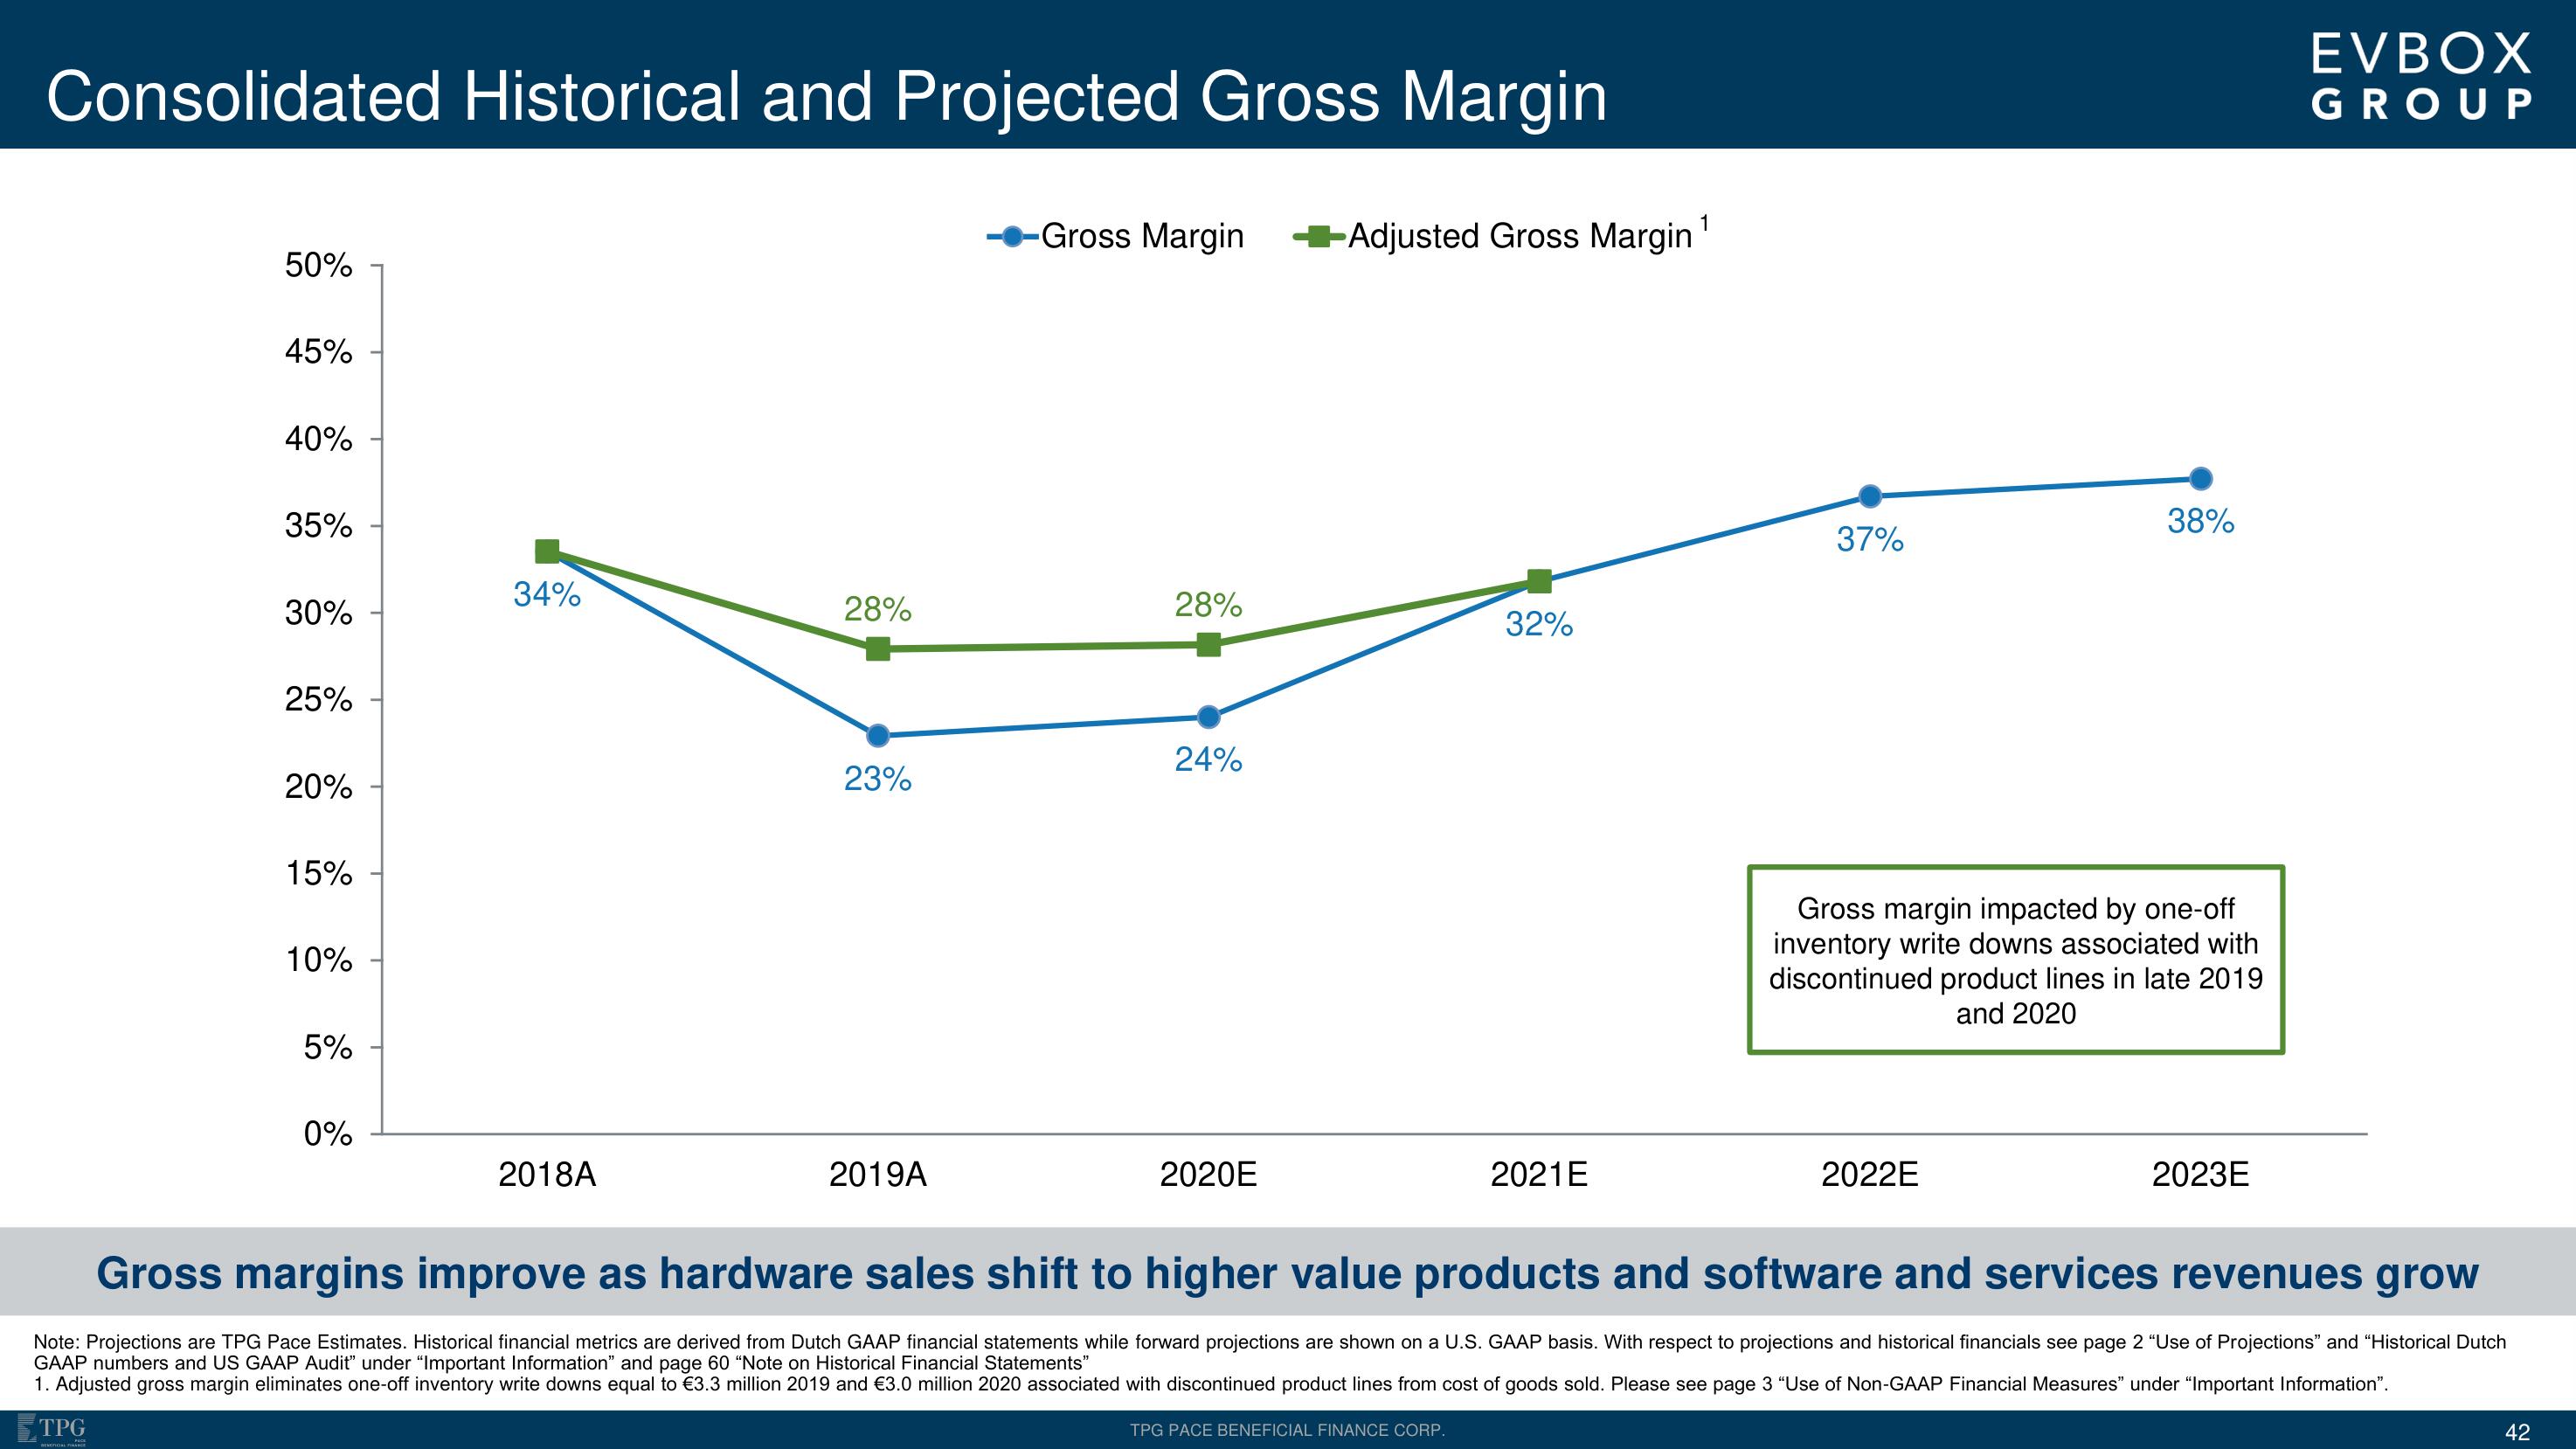
Consolidated Historical and Projected Gross Margin
50%
45%
40%
35%
30%
25%
20%
15%
10%
5%
0%
34%
2018A
28%
23%
2019A
-Gross Margin
28%
24%
2020E
Adjusted Gross Margin
32%
TPG PACE BENEFICIAL FINANCE CORP.
2021E
1
37%
38%
Gross margin impacted by one-off
inventory write downs associated with
discontinued product lines in late 2019
and 2020
2022E
2023E
EVBOX
GROUP
Gross margins improve as hardware sales shift to higher value products and software and services revenues grow
Note: Projections are TPG Pace Estimates. Historical financial metrics are derived from Dutch GAAP financial statements while forward projections are shown on a U.S. GAAP basis. With respect to projections and historical financials see page 2 "Use of Projections" and "Historical Dutch
GAAP numbers and US GAAP Audit" under "Important Information" and page 60 "Note on Historical Financial Statements"
1. Adjusted gross margin eliminates one-off inventory write downs equal to €3.3 million 2019 and €3.0 million 2020 associated with discontinued product lines from cost of goods sold. Please see page 3 "Use of Non-GAAP Financial Measures" under "Important Information".
TPG
42View entire presentation