Q1 2023 Earnings Presentation
NON-GAAP FINANCIAL PERFORMANCE
Q1 2023 Non-GAAP Results Year-over-Year
[$M, except EPS]
Total Revenues
Gross Profit
Margin (% of revenues)
SG&A
(% of revenues)
R&D
(% of revenues)
Operating Profit
(% of revenues)
Tax Rate
Net Income*
EPS
Shares Outstanding
Q1 2023
685.3
365.9
53.4%
2023 Bruker
(157.4)
23.0%
(69.0)
10.1%
139.4
20.3%
27.8%
95.1
$0.64
147.6
Q1 2022
595.0
313.3
52.7%
(140.9)
23.7%
(56.6)
9.5%
115.8
19.5%
32.7%
74.6
$0.49
151.4
A
+15.2%
+16.8%
+70 bps
+11.7%
+21.9%
+20.4%
+80 bps
-490 bps
+27.5%
+30.6%
-2.5%
*Attributable to Bruker. Sum of items may not total due to rounding.
Reconciliations of non-GAAP to GAAP financial measures are available in our earnings press release and at the end of this presentation.
BRUKER
Comments (year-over-year)
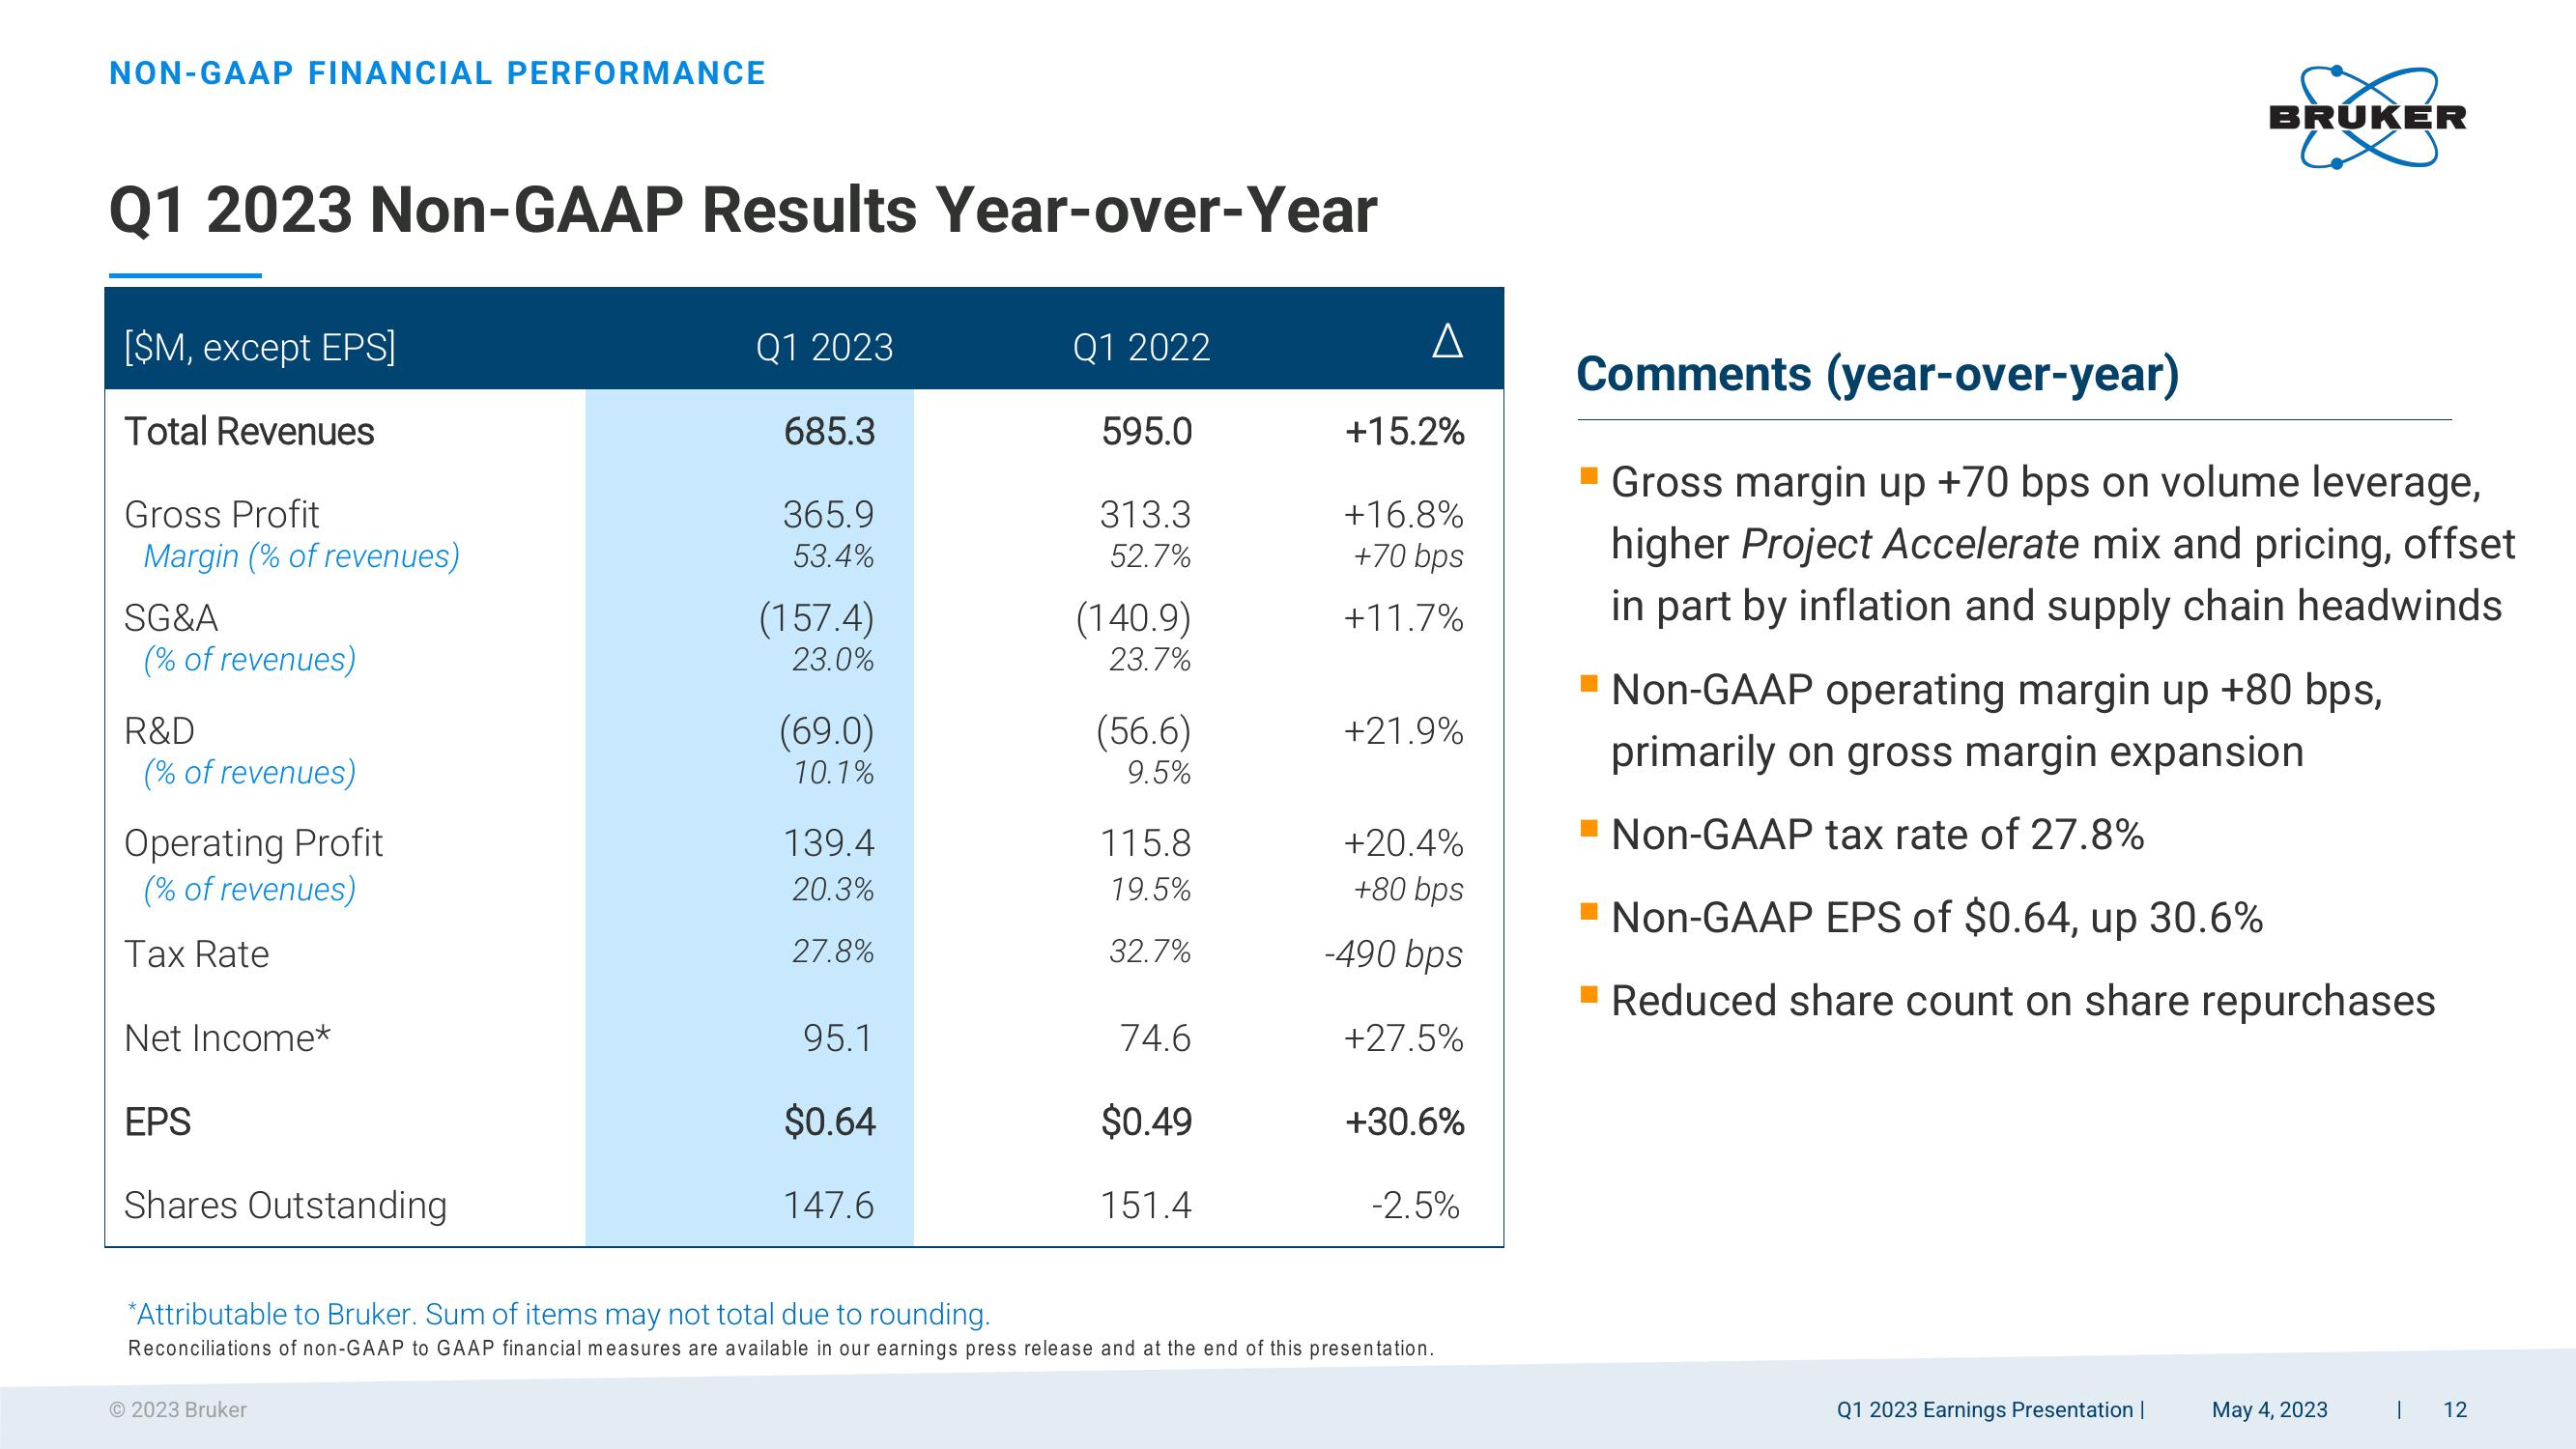
Gross margin up +70 bps on volume leverage,
higher Project Accelerate mix and pricing, offset
in part by inflation and supply chain headwinds
Non-GAAP operating margin up +80 bps,
primarily on gross margin expansion
Non-GAAP tax rate of 27.8%
Non-GAAP EPS of $0.64, up 30.6%
Reduced share count on share repurchases
Q1 2023 Earnings Presentation |
May 4, 2023
I 12View entire presentation