Science 37 SPAC
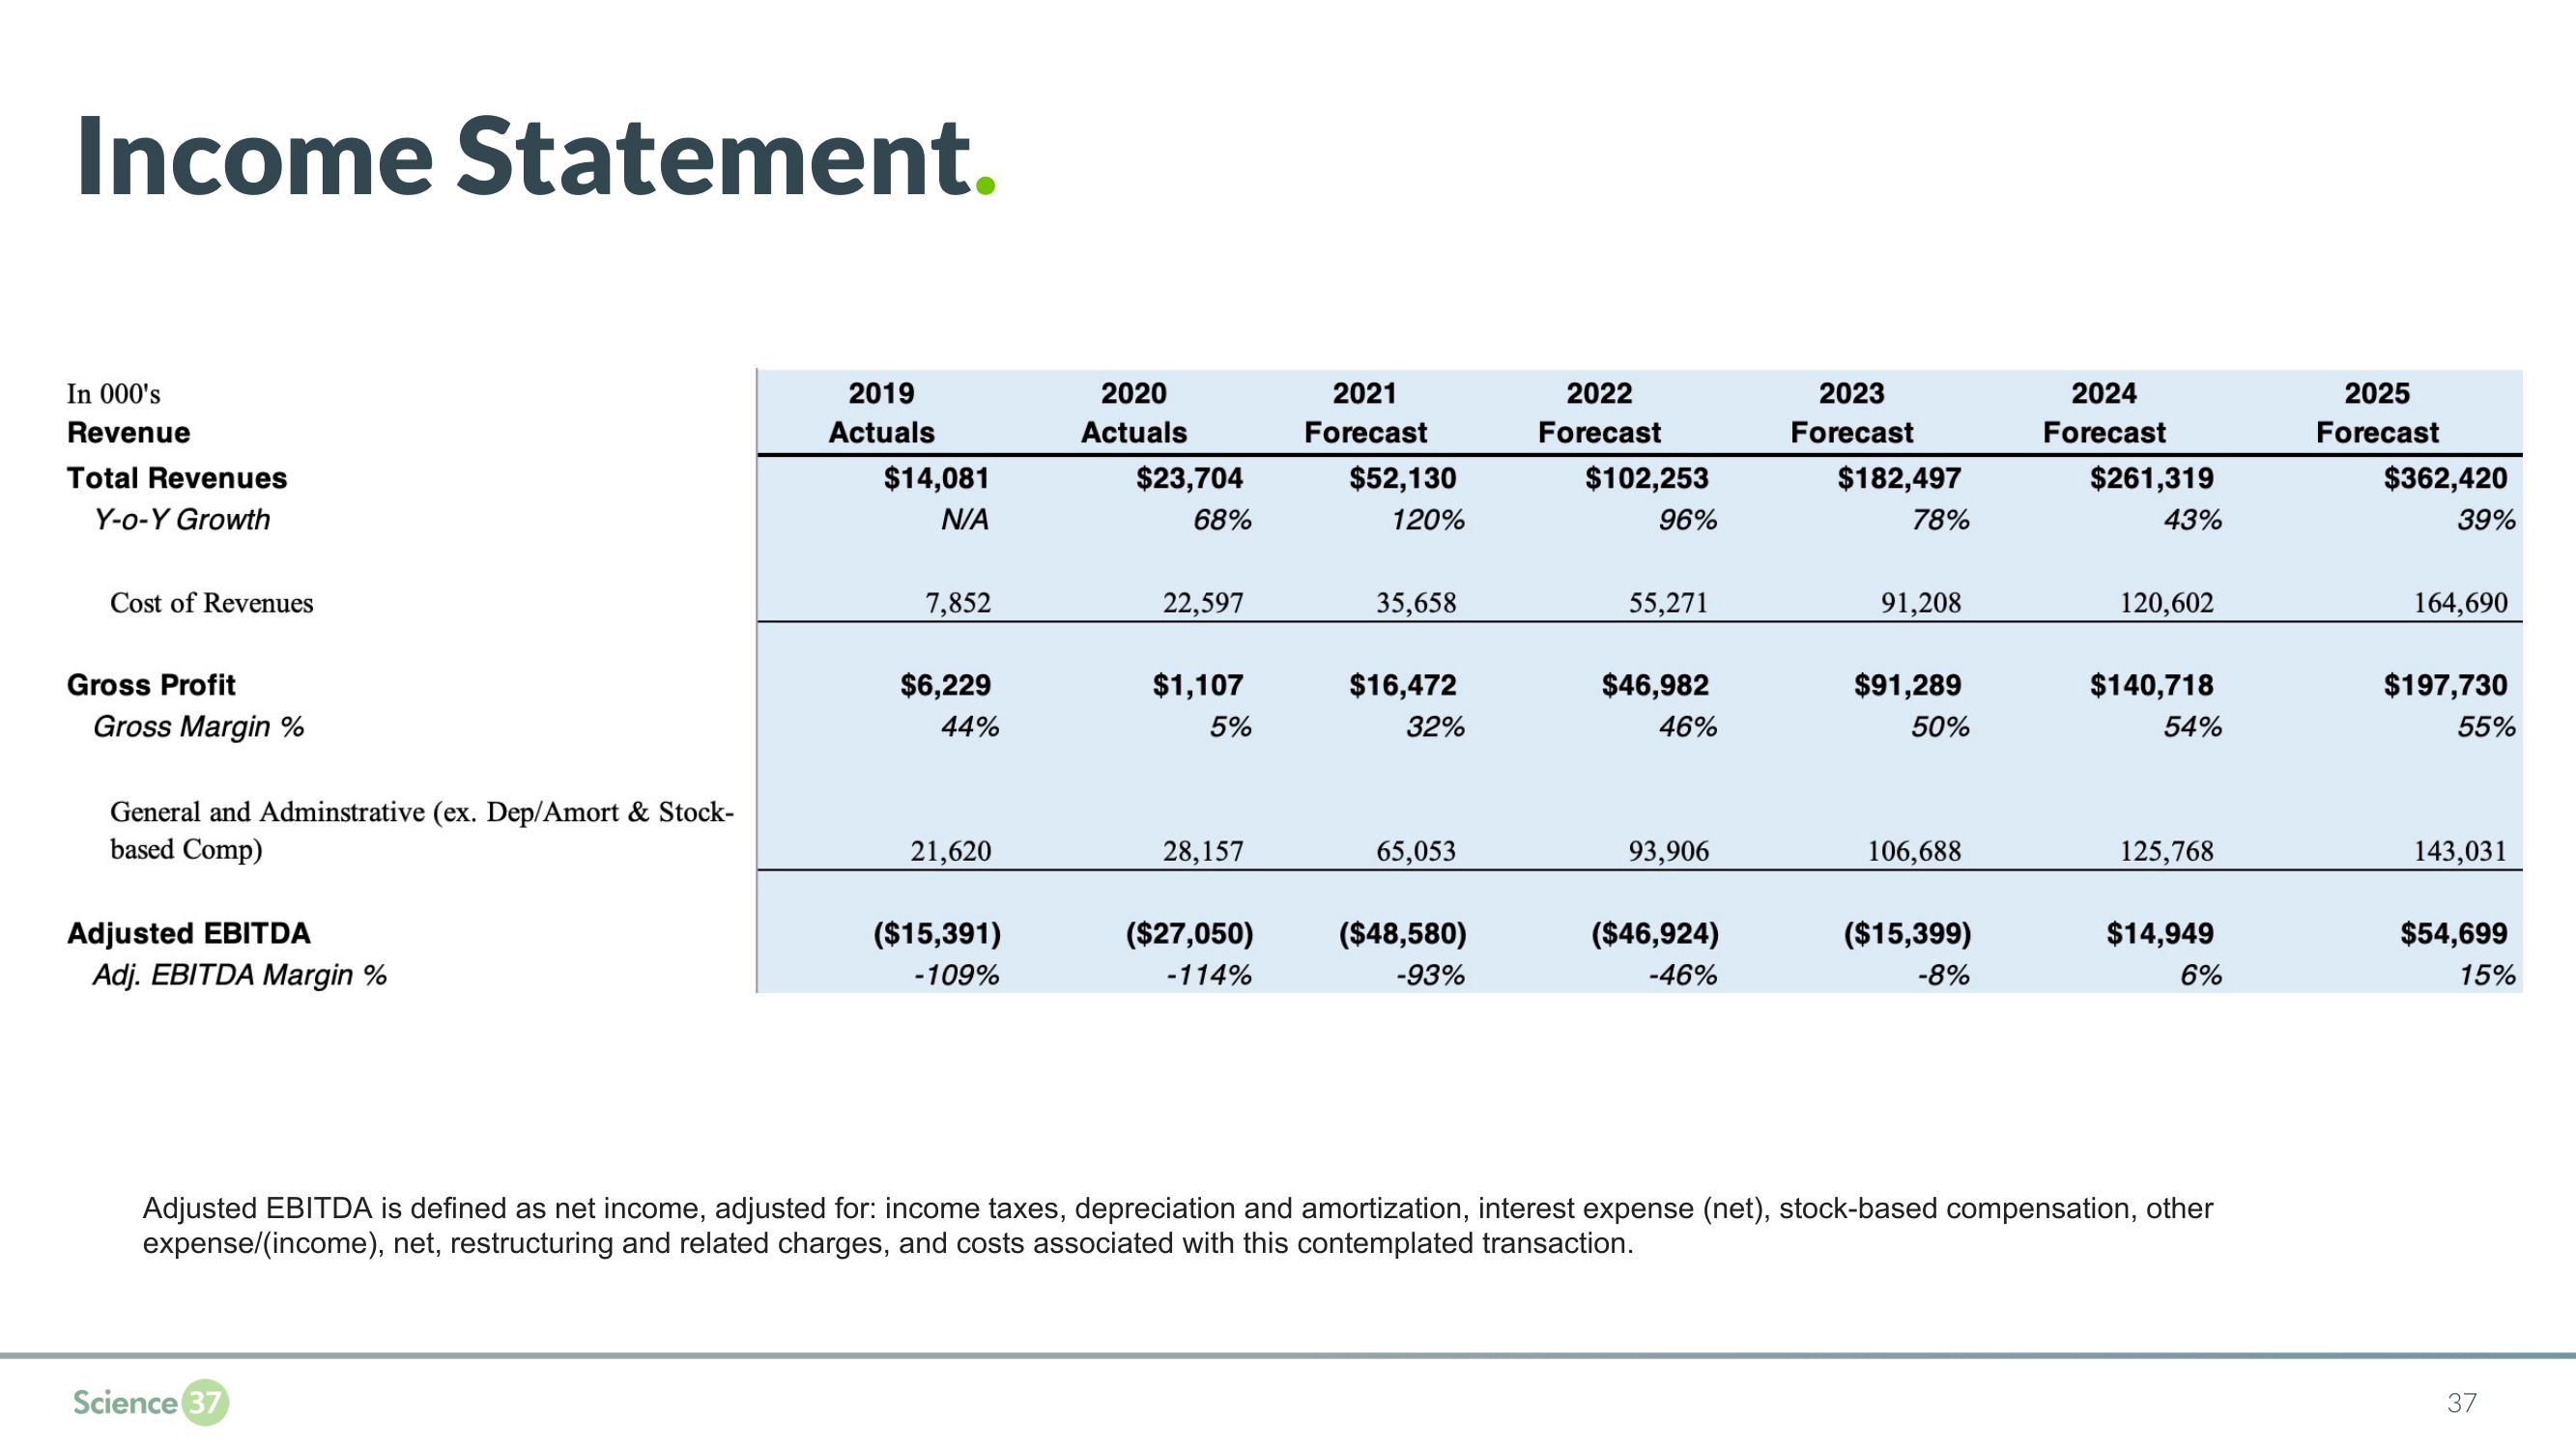
Income Statement.
In 000's
Revenue
Total Revenues
Y-o-Y Growth
Cost of Revenues
Gross Profit
Gross Margin %
General and Adminstrative (ex. Dep/Amort & Stock-
based Comp)
Adjusted EBITDA
Adj. EBITDA Margin %
2019
Actuals
Science 37
$14,081
N/A
7,852
$6,229
44%
21,620
($15,391)
-109%
2020
Actuals
$23,704
68%
22,597
$1,107
5%
28,157
($27,050)
-114%
2021
Forecast
$52,130
120%
35,658
$16,472
32%
65,053
($48,580)
-93%
2022
Forecast
$102,253
96%
55,271
$46,982
46%
93,906
($46,924)
-46%
2023
Forecast
$182,497
78%
91,208
$91,289
50%
106,688
($15,399)
-8%
2024
Forecast
$261,319
43%
120,602
$140,718
54%
125,768
$14,949
6%
Adjusted EBITDA is defined as net income, adjusted for: income taxes, depreciation and amortization, interest expense (net), stock-based compensation, other
expense/(income), net, restructuring and related charges, and costs associated with this contemplated transaction.
2025
Forecast
$362,420
39%
164,690
$197,730
55%
143,031
$54,699
15%
37View entire presentation