Silicon Valley Bank Results Presentation Deck
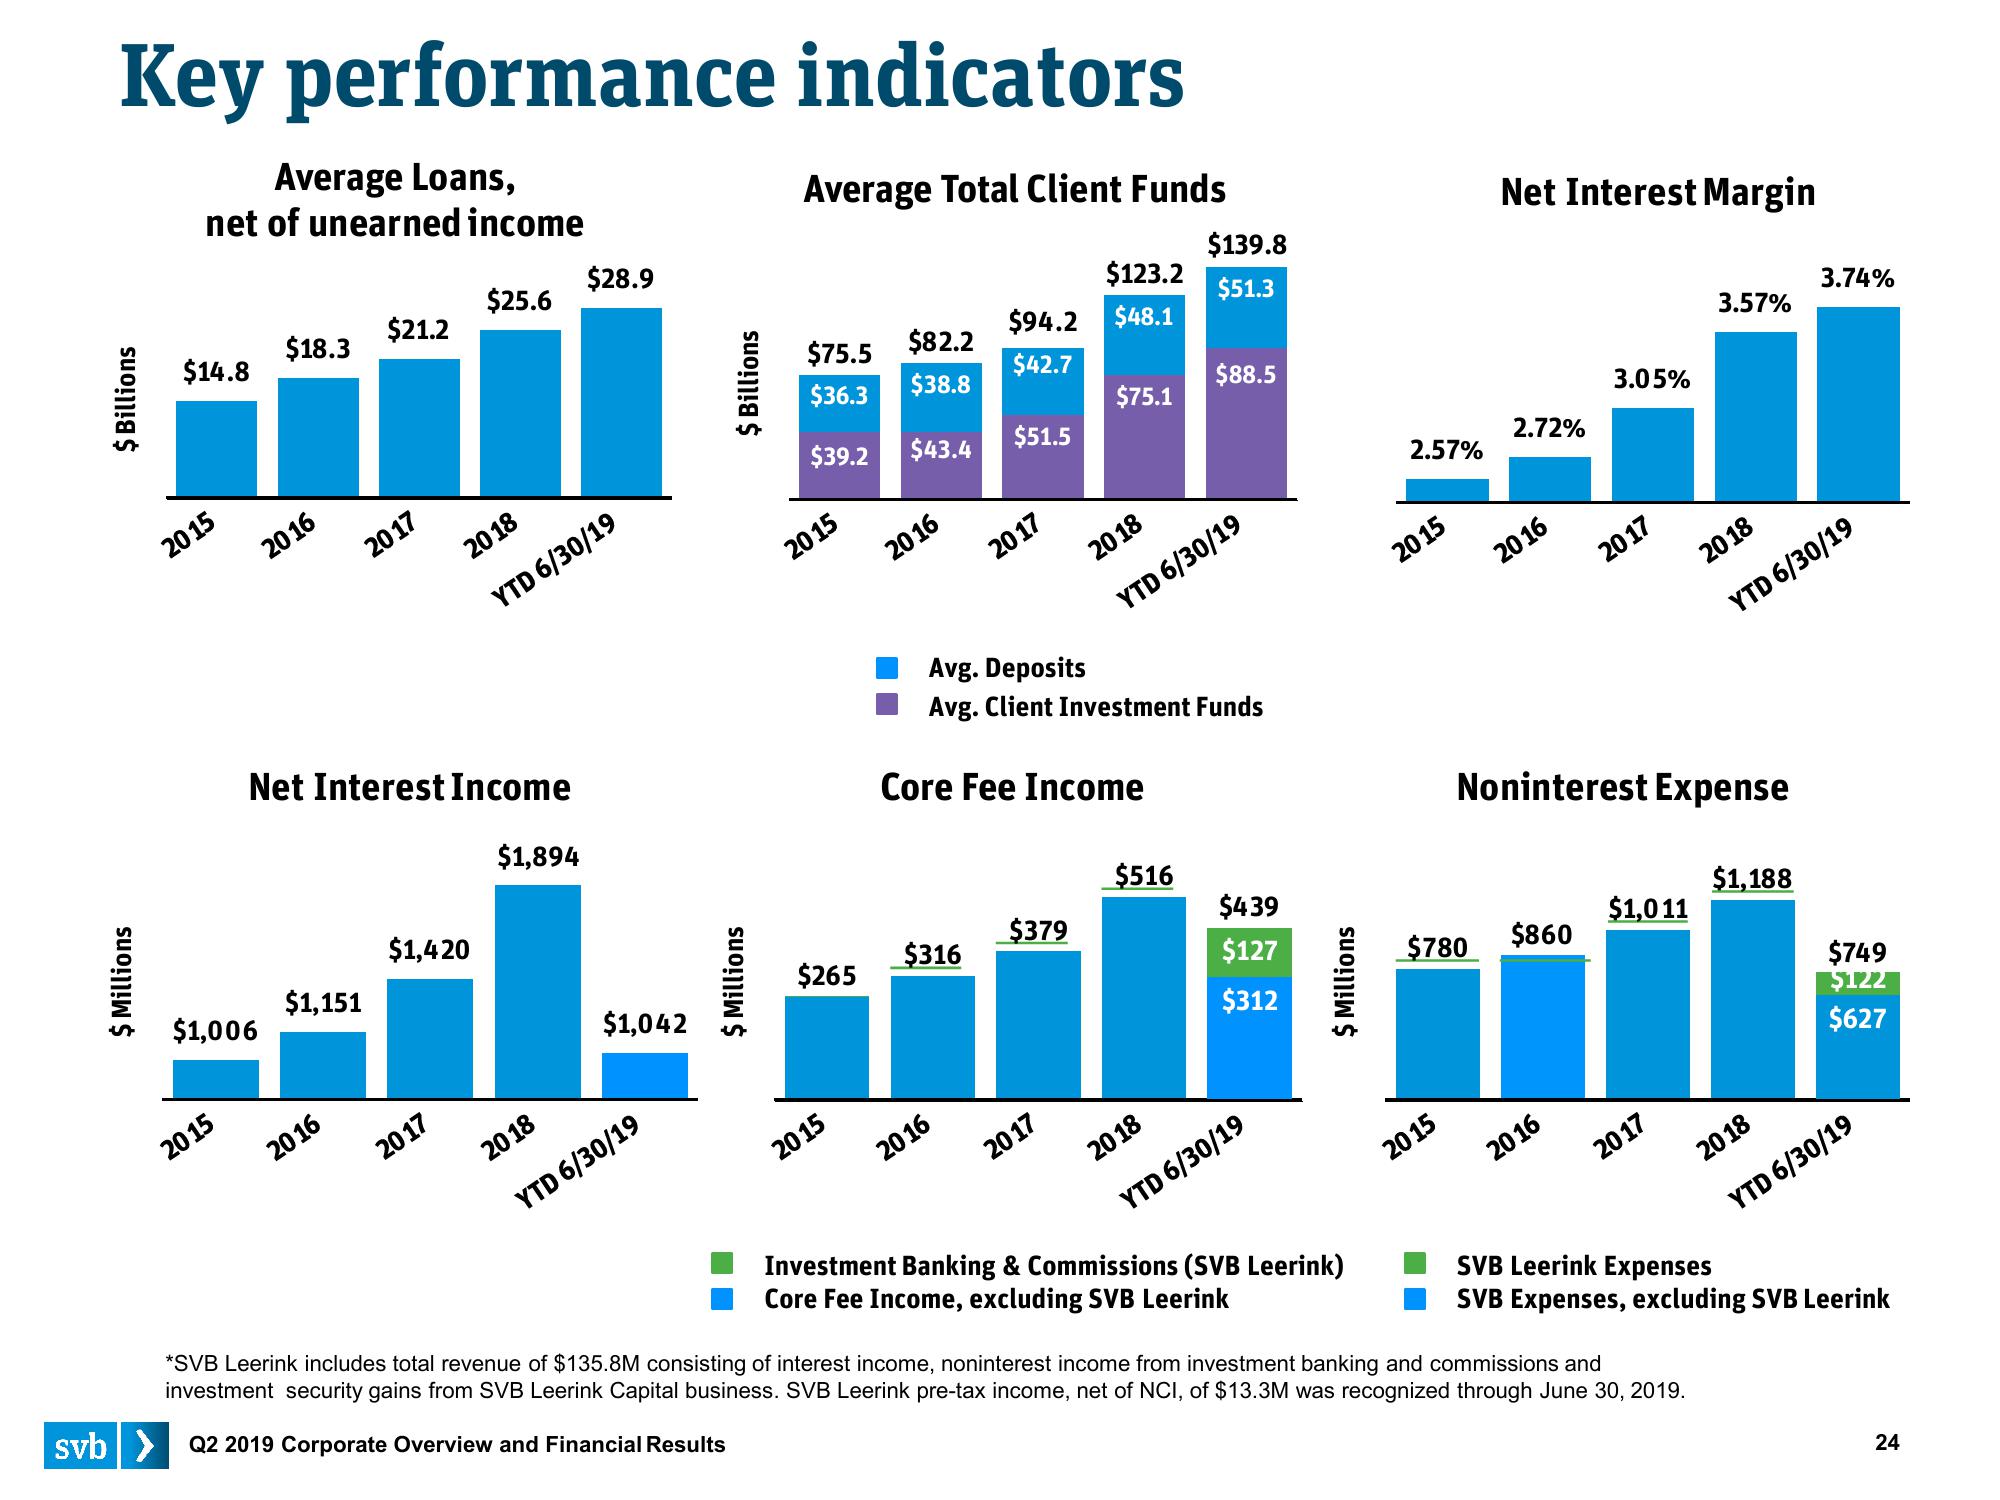
Key performance indicators
Average Loans,
Average Total Client Funds
net of unearned income
$ Billion
5 Millions
I$
$14.8
2015
$1,006
2015
$18.3
2016
$21.2
2017
$1,151
2016
Net Interest Income
$1,894
$25.6
$1,420
2017
2018
YTD 6/30/19
$28.9
$1,042
2018
YTD 6/30/19
Billions
$
$ Millions
$82.2
$75.5
$36.3
$38.8
$39.2 $43.4
2015
$265
2015
2016
$316
$123.2
$48.1
$94.2
$42.7
$51.5
2016
2017
Core Fee Income
$75.1
Avg. Deposits
Avg. Client Investment Funds
$379
2017
$139.8
$51.3
2018
YTD 6/30/19
$88.5
$516
$439
$127
$312
2018
YTD 6/30/19
5 Millions
$
Investment Banking & Commissions (SVB Leerink)
Core Fee Income, excluding SVB Leerink
2.57%
2015
$780
2015
Net Interest Margin
2.72%
2016
$860
3.05%
2016
2017
Noninterest Expense
$1,011
2017
3.57%
*SVB Leerink includes total revenue of $135.8M consisting of interest income, noninterest income from investment banking and commissions and
investment security gains from SVB Leerink Capital business. SVB Leerink pre-tax income, net of NCI, of $13.3M was recognized through June 30, 2019.
svb> Q2 2019 Corporate Overview and Financial Results
2018
YTD 6/30/19
3.74%
$1,188
$749
$122
$627
2018
YTD 6/30/19
SVB Leerink Expenses
SVB Expenses, excluding SVB Leerink
24View entire presentation