Bank of America Investment Banking Pitch Book
Discounted Cash Flow Analysis
Unlevered Free Cash Flows
Year
Total NOI
Capitalized G&A
+ Net Capitalized RE Taxes and Insurance and TIF Tax Revenue
Increase in Net Working Capital
Capital Expenditures (
Other Costs
Capitalized IT
Proceeds from Dispositions
+JV Management Fees
Unlevered Free Cash Flows
Discount
Rate
8.25%
8.50%
8.75%
Discount
Rate
10
8.25%
8.50%
8.75%
(2)
(3)
A
Discounted
Cash Flows
$641
637
634
E
Minority
Interest
B
PV of Terminal Value
Based on Perpetuity Growth
1.50%
1.75%
2.00%
$2.198 $2,288 $2,385
2,095
2.178
1,999
2,076
F
A
Total Implied
Equity Value
2,267
2,158
2016E
$215
(18)
(161)
(1)
(1)
146
$155
For Fiscal Year Ending December 31.
2018E
$269
2017E
$239
(27)
(16)
1
(132)
Au
1
$65
G
1.50%
$2.839
2,732
2,633
(14)
FD Shares
Outstanding
(86)
(1)
1
$143
C
Total Implied
Enterprise Value
1.75%
$2,929
2,815
2,710
2019E
$280
3
(26)
(1)
(0)
1
$214
2.00%
$3,027
2,792
2020E
$290
1.50%
$18.75
16.75
15.25
(29)
(14)
3
(26)
[1]
[0]
1
$224
Normalized
$290
($29)
($14)
Implied Equity Value
per Diluted Share
1.75%
$20.25
18.25
16.50
(30)
(0)
1
$217
Net Debt
+ Pref
($1,740)
(1,740)
(1,740)
Discount Rate
2.00%
$22.00
19.75
17.75
Discount Rate
8.25%
8.50%
8.75%
Bank of America
Merrill Lynch
Implied Core EBITDA Multiple
Perpetuity Growth
1.50%
1.75%
1253
12.1x
11,6x
8.25%
8.50%
12.0x
11.6x
11.2x
(1)
Terminal Value as % of Total Value
1.50%
77.4%
76.7%
75.9%
($14)
58.1
1.50% 1.75% 2.00%
$1,085 $1,175 $1,272
1,061
955
(14)
(14)
978
879
1,150
1,037
58.1
58.1
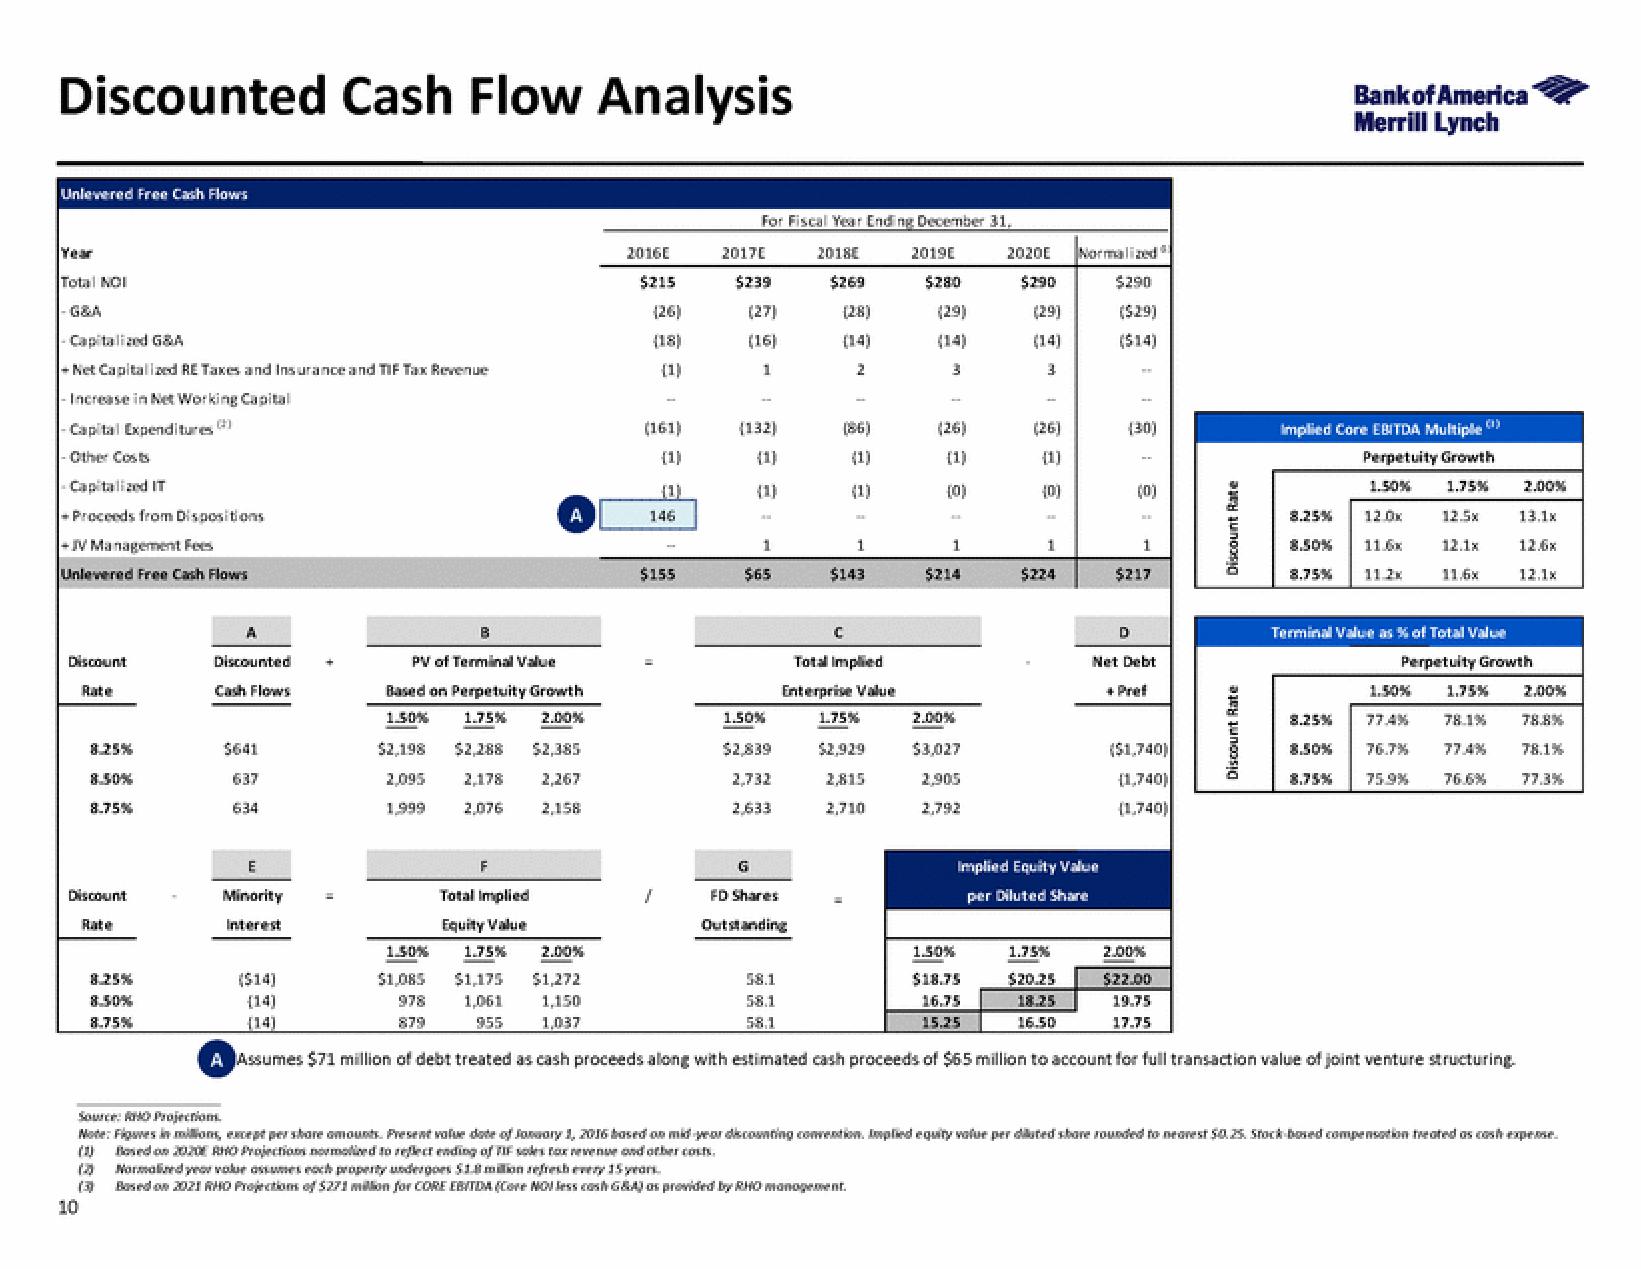
A Assumes $71 million of debt treated as cash proceeds along with estimated cash proceeds of $65 million to account for full transaction value of joint venture structuring.
Perpetuity Growth
2.00%
13.1x
12.6x
12.1x
1.75%
78.1%
78.8%
77.4% 78.1%
76.6% 77.3%
Source: RHO Projection.
Note: Figures in millions, except per share amounts. Present value dote of January 1, 2016 based on mid year discounting convention. Implied equity value per diluted share rounded to nearest $0.25. Stock bosed compensation treated as cash exprose.
(10) Based on 2020 RHO Projections normalized to reflect ending of TIF soles fox revenue and other costs.
Normalized year volue assumes each property undergoes $1.8 million refresh every 15 years.
Based on 2021 RHO Projection of $271 million for CORE EBITDA (Core NO! less cash G&A) os provided by RHO management.View entire presentation