Main Street Capital Investor Day Presentation Deck
Stress Test 2023 Leverage Position
Adjusted to the
High End Target
Leverage
4,609,255
($'s in 000's)
Total Assets
Debt Capital
Revolving Credit Facility
SBIC Debentures
Notes Payable
Total Debt
Total Debt, excl. SBIC
Debentures
Net Asset Value (NAV)
As of March
31, 2023
$ 4,293,255
$ 564,000 $
334,000 $
$ 1,100,000
$ 1,998,000 $
$ 1,664,000
$ 2,172,922
New
Investments
funded by Debt
316,000
$
2.30
0.77
$
300,000 $ 864,000
16,000 $ 350,000
$ 1,100,000
316,000 $ 2,314,000
$
$
1,964,000
2,172,922
2.10
Stress Test
(10% reduction
in Fair Value
$ (460,926) $
0.90
$
$
Proforma after
Stress Impacts
$
$
$
$
(460,926) $
4,148,330
NYSE: MAIN
1,964,000
1.87
MAINST
CAPITAL CORPORATION
1.15
Additional
Equity
Issuances
864,000 $ (105,000) $
350,000
$
1,100,000
$
2,314,000 $ (105,000) $
$
1,711,997 $ 105,000 $
Proforma after
Additional Equity
Issuances
$
4,148,330
759,000
350,000
1,100,000
2,209,000
Asset Coverage Ratio
Debt to Equity Ratio
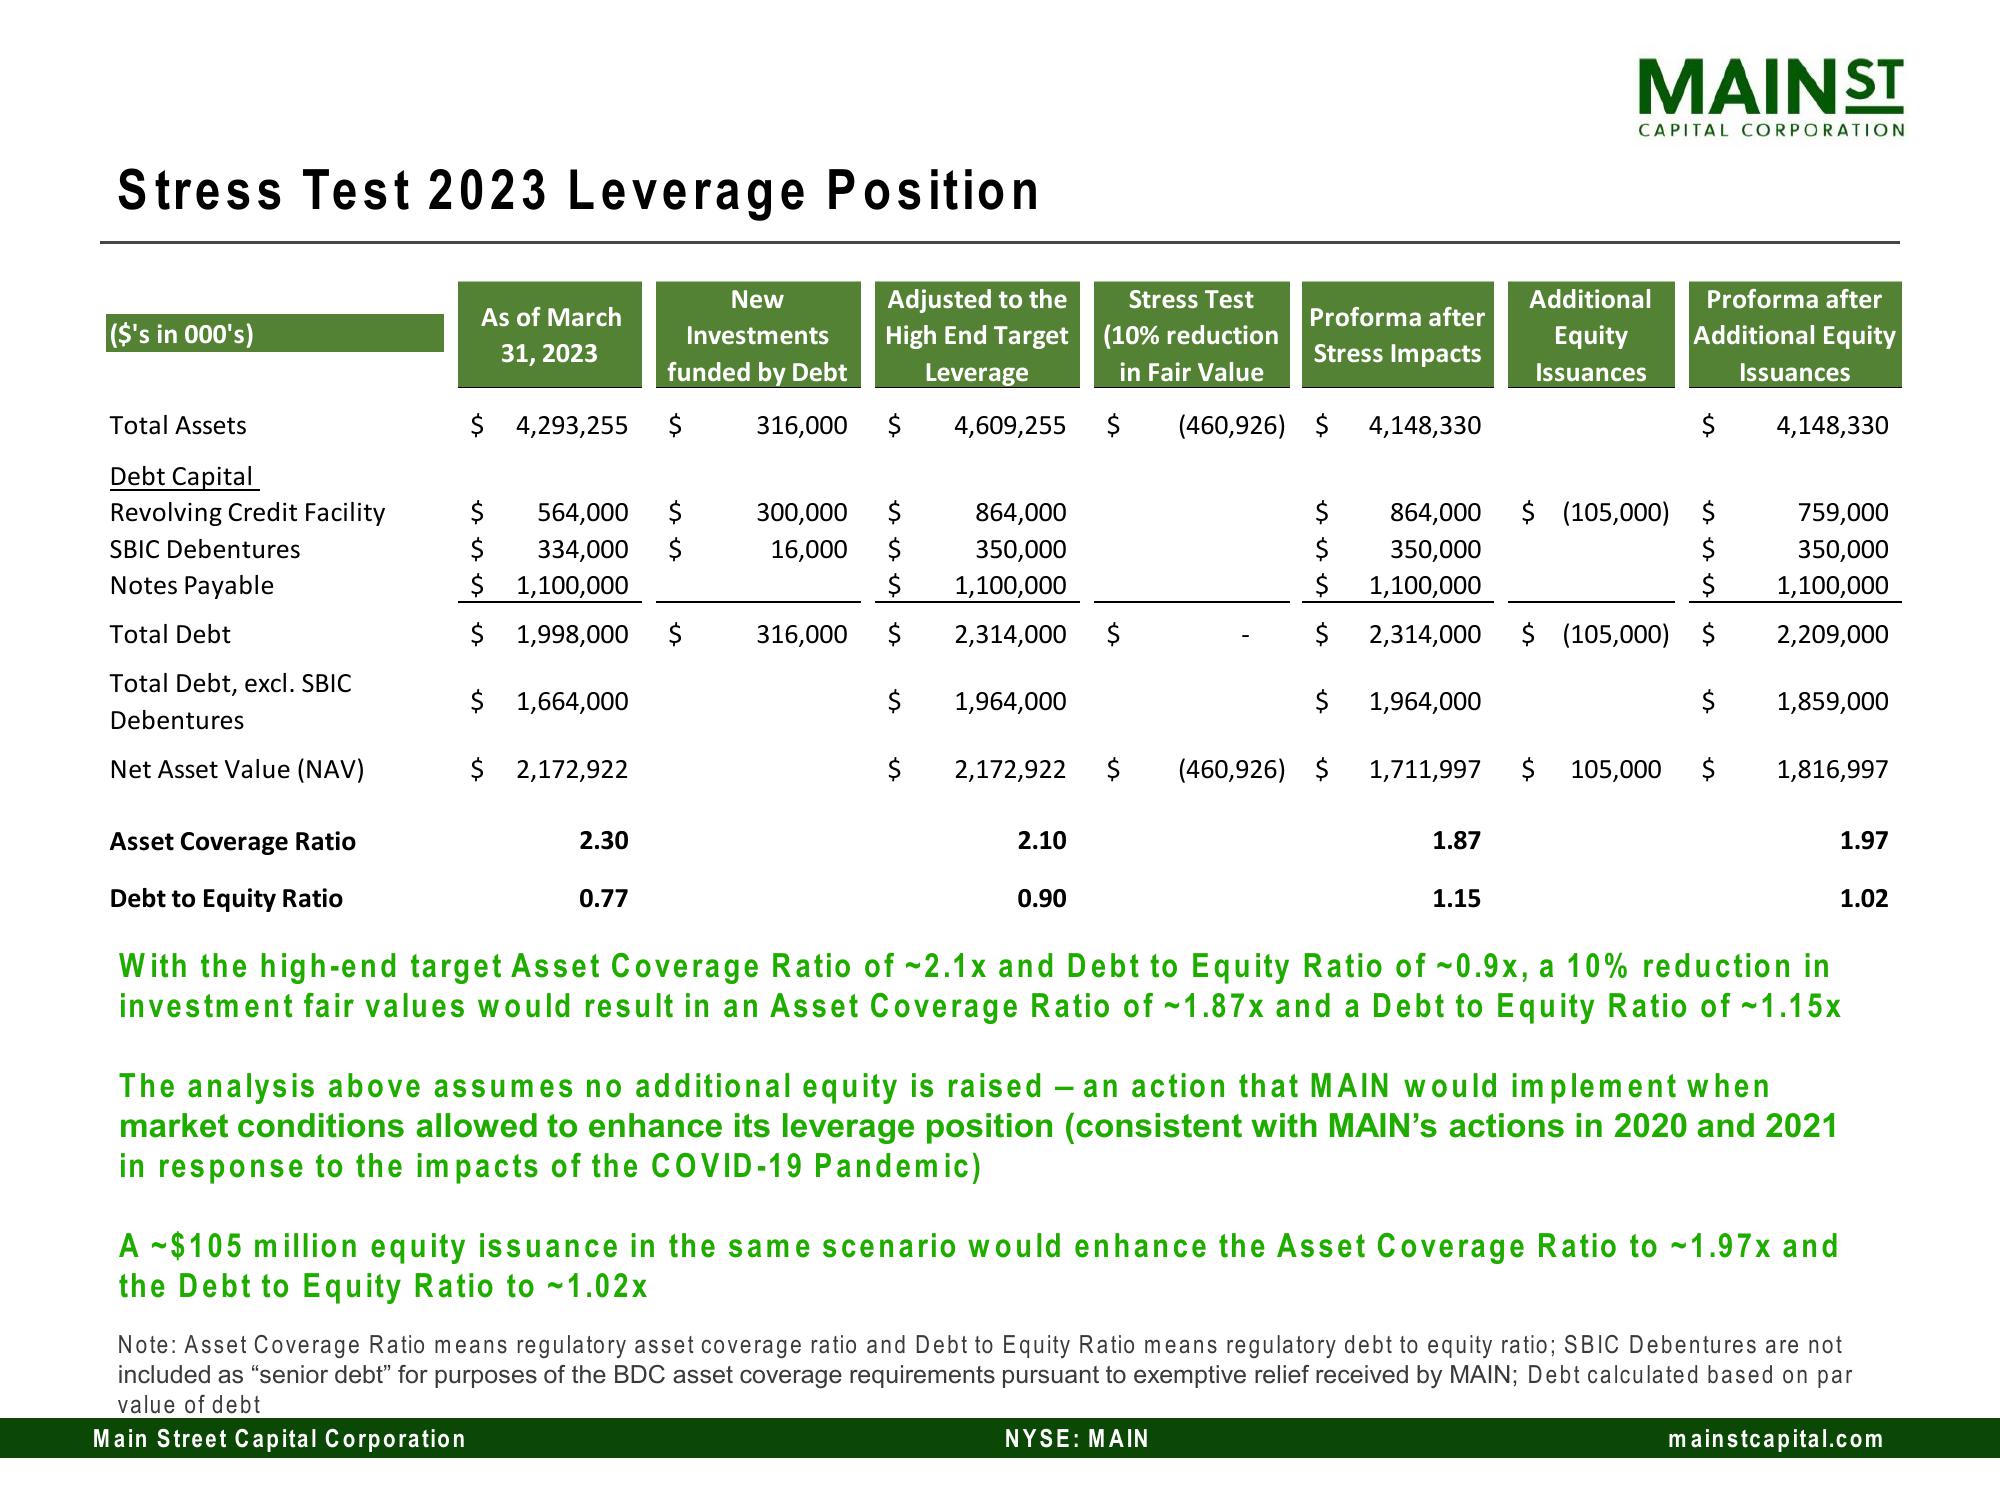
With the high-end target Asset Coverage Ratio of -2.1x and Debt to Equity Ratio of ~0.9x, a 10% reduction in
investment fair values would result in an Asset Coverage Ratio of ~1.87x and a Debt to Equity Ratio of ~1.15x
1,859,000
1,816,997
The analysis above assumes no additional equity is raised - an action that MAIN would implement when
market conditions allowed to enhance its leverage position (consistent with MAIN's actions in 2020 and 2021
in response to the impacts of the COVID-19 Pandemic)
1.97
1.02
A -$105 million equity issuance in the same scenario would enhance the Asset Coverage Ratio to -1.97x and
the Debt to Equity Ratio to -1.02x
Note: Asset Coverage Ratio means regulatory asset coverage ratio and Debt to Equity Ratio means regulatory debt to equity ratio; SBIC Debentures are not
included as "senior debt" for purposes of the BDC asset coverage requirements pursuant to exemptive relief received by MAIN; Debt calculated based on par
value of debt
Main Street Capital Corporation
mainstcapital.comView entire presentation