Antero Midstream Partners Mergers and Acquisitions Presentation Deck
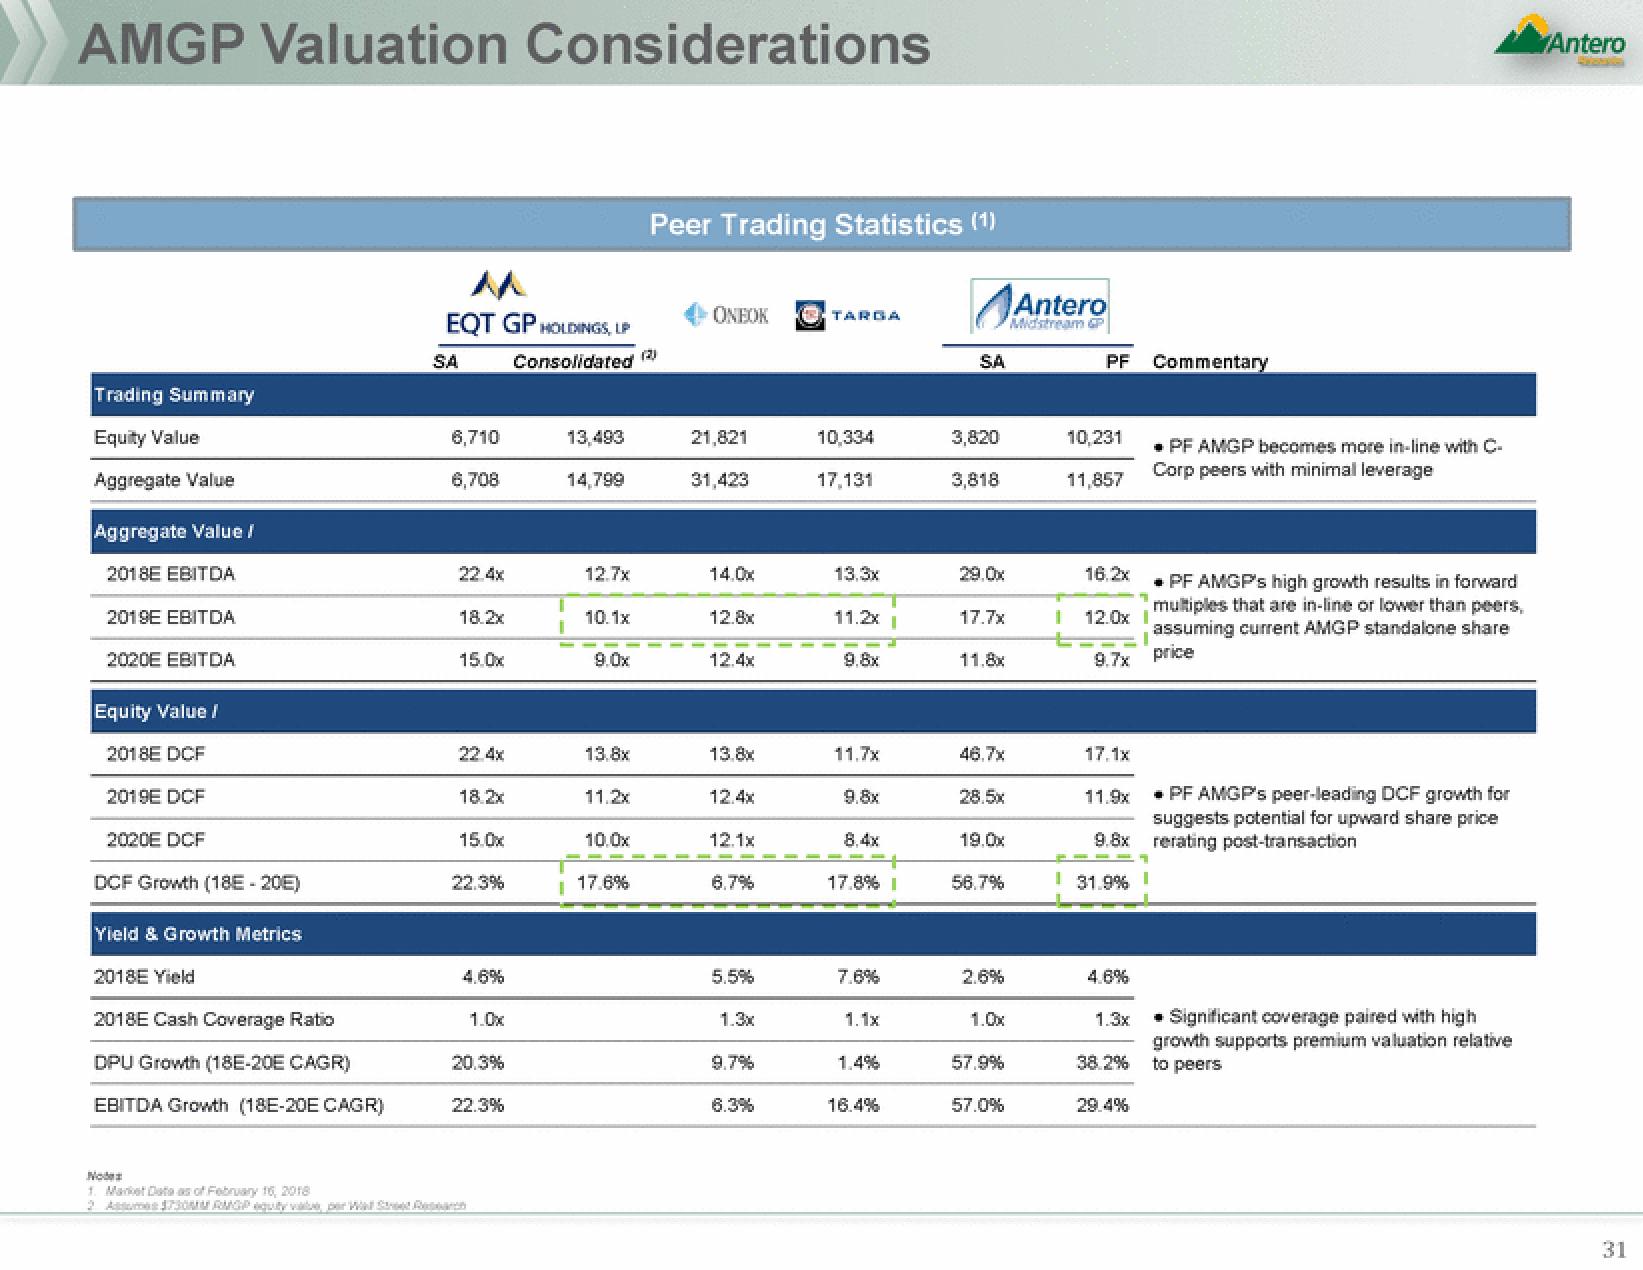
AMGP Valuation Considerations
Trading Summary
Equity Value
Aggregate Value
Aggregate Value /
2018E EBITDA
2019E EBITDA
2020E EBITDA
Equity Value /
2018E DCF
2019E DCF
2020E DCF
DCF Growth (18E-20E)
Yield & Growth Metrics
2018E Yield
2018E Cash Coverage Ratio
DPU Growth (18E-20E CAGR)
EBITDA Growth (18E-20E CAGR)
1. Market Data as of February 16, 2018
M
EQT GP HOLDINGS, LP
SA
6,710
6,708
18.2x
15.0x
22.4x
18.2x
15.0x
22.3%
1.0x
20.3%
22.3%
Consolidated (2)
i
13,493
14,799
12.7x
10.1x
9.0x
13.8x
11.2x
10.0x
Peer Trading Statistics (1)
I 17.6%
ONEOK
21,821
31,423
14.0x
12.8x
12.4x
13.8x
12.4x
12.1x
6.7%
5.5%
1.3x
9.7%
6.3%
TARGA
RGA
10,334
17,131
13.3x
11.2x
9.8x
11.7x
9.8x
8.4x
17.8% I
7.6%
1.1x
1.4%
16.4%
SA
3,820
3,818
29.0x
17.7x
11.8x
46.7x
28.5
19.0x
56.7%
2.6%
1.0x
Antero
Midstream GP
57.9%
57.0%
PF
10,231
11,857
16.2x
1 12.0x
9.7x
17.1x
11.9x
4.6%
* PF AMGP's peer-leading DCF growth for
suggests potential for upward share price
9.8x rerating post-transaction
31.9%
1.3x
38.2%
Commentary
29.4%
PF AMGP becomes more in-line with C-
Corp peers with minimal leverage
* PF AMGP's high growth results in forward
multiples that are in-line or lower than peers,
assuming current AMGP standalone share
price
Significant coverage paired with high
growth supports premium valuation relative
to peers
Antero
31View entire presentation