Tudor, Pickering, Holt & Co Investment Banking
Contribution Analysis | Status Quo AM & AMGP
Supplemental Calculation | AR Downside Volumes Case
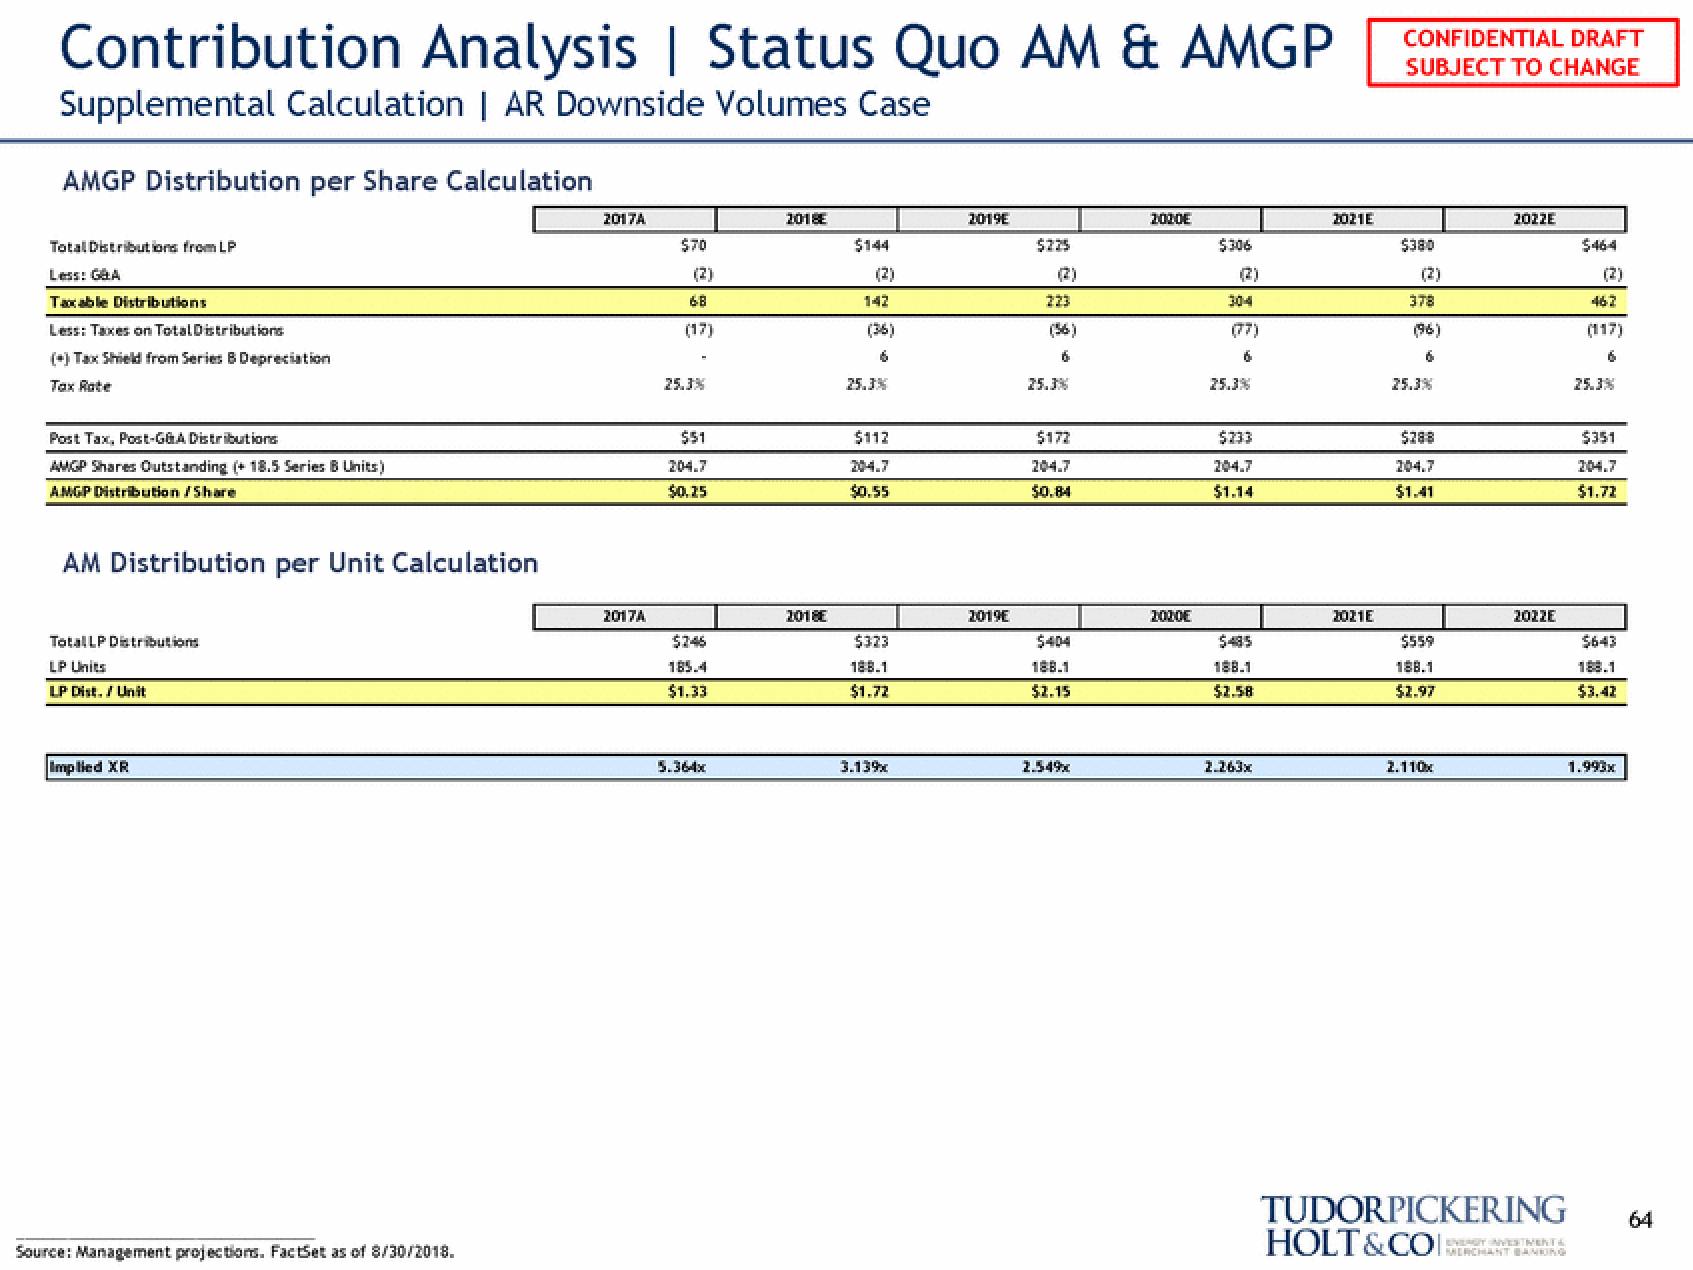
AMGP Distribution per Share Calculation
Total Distributions from LP
Less: G&A
Taxable Distributions
Less: Taxes on Total Distributions
(+) Tax Shield from Series B Depreciation
Tax Rate
Post Tax, Post-GGA Distributions
AMGP Shares Outstanding (+ 18.5 Series B Units)
AMGP Distribution/Share
AM Distribution per Unit Calculation
TotalLP Distributions
LP Units
LP Dist. / Unit
Implied XR
Source: Management projections. FactSet as of 8/30/2018.
2017A
2017A
$70
(2)
68
(17)
25.3%
$51
204.7
$0.25
$746
185.4
$1.33
5.364x
2018
2018
$144
(2)
142
6
25.3%
$112
$0.55
$323
188.1
$1.72
3.13%
2019E
2019E
$225
223
(56)
6
25.3%
$172
50.84
$404
188.1
$2.15
2.54%
2020E
2000€
$306
(2)
304
6
25.3%
$733
204.7
$1.14
188.1
$2.58
2.263x
2021E
2021E
CONFIDENTIAL DRAFT
SUBJECT TO CHANGE
$380
(2)
378
(96)
6
25.3%
$288
$1.41
$559
188.1
$2.97
2.110x
2022E
2022E
$464
TUDORPICKERING
HOLT&COCHANT BANKING
(2)
462
(117)
6
25.3%
$351
$1.72
188.1
$3.42
1.993x
64View entire presentation