Comcast Results Presentation Deck
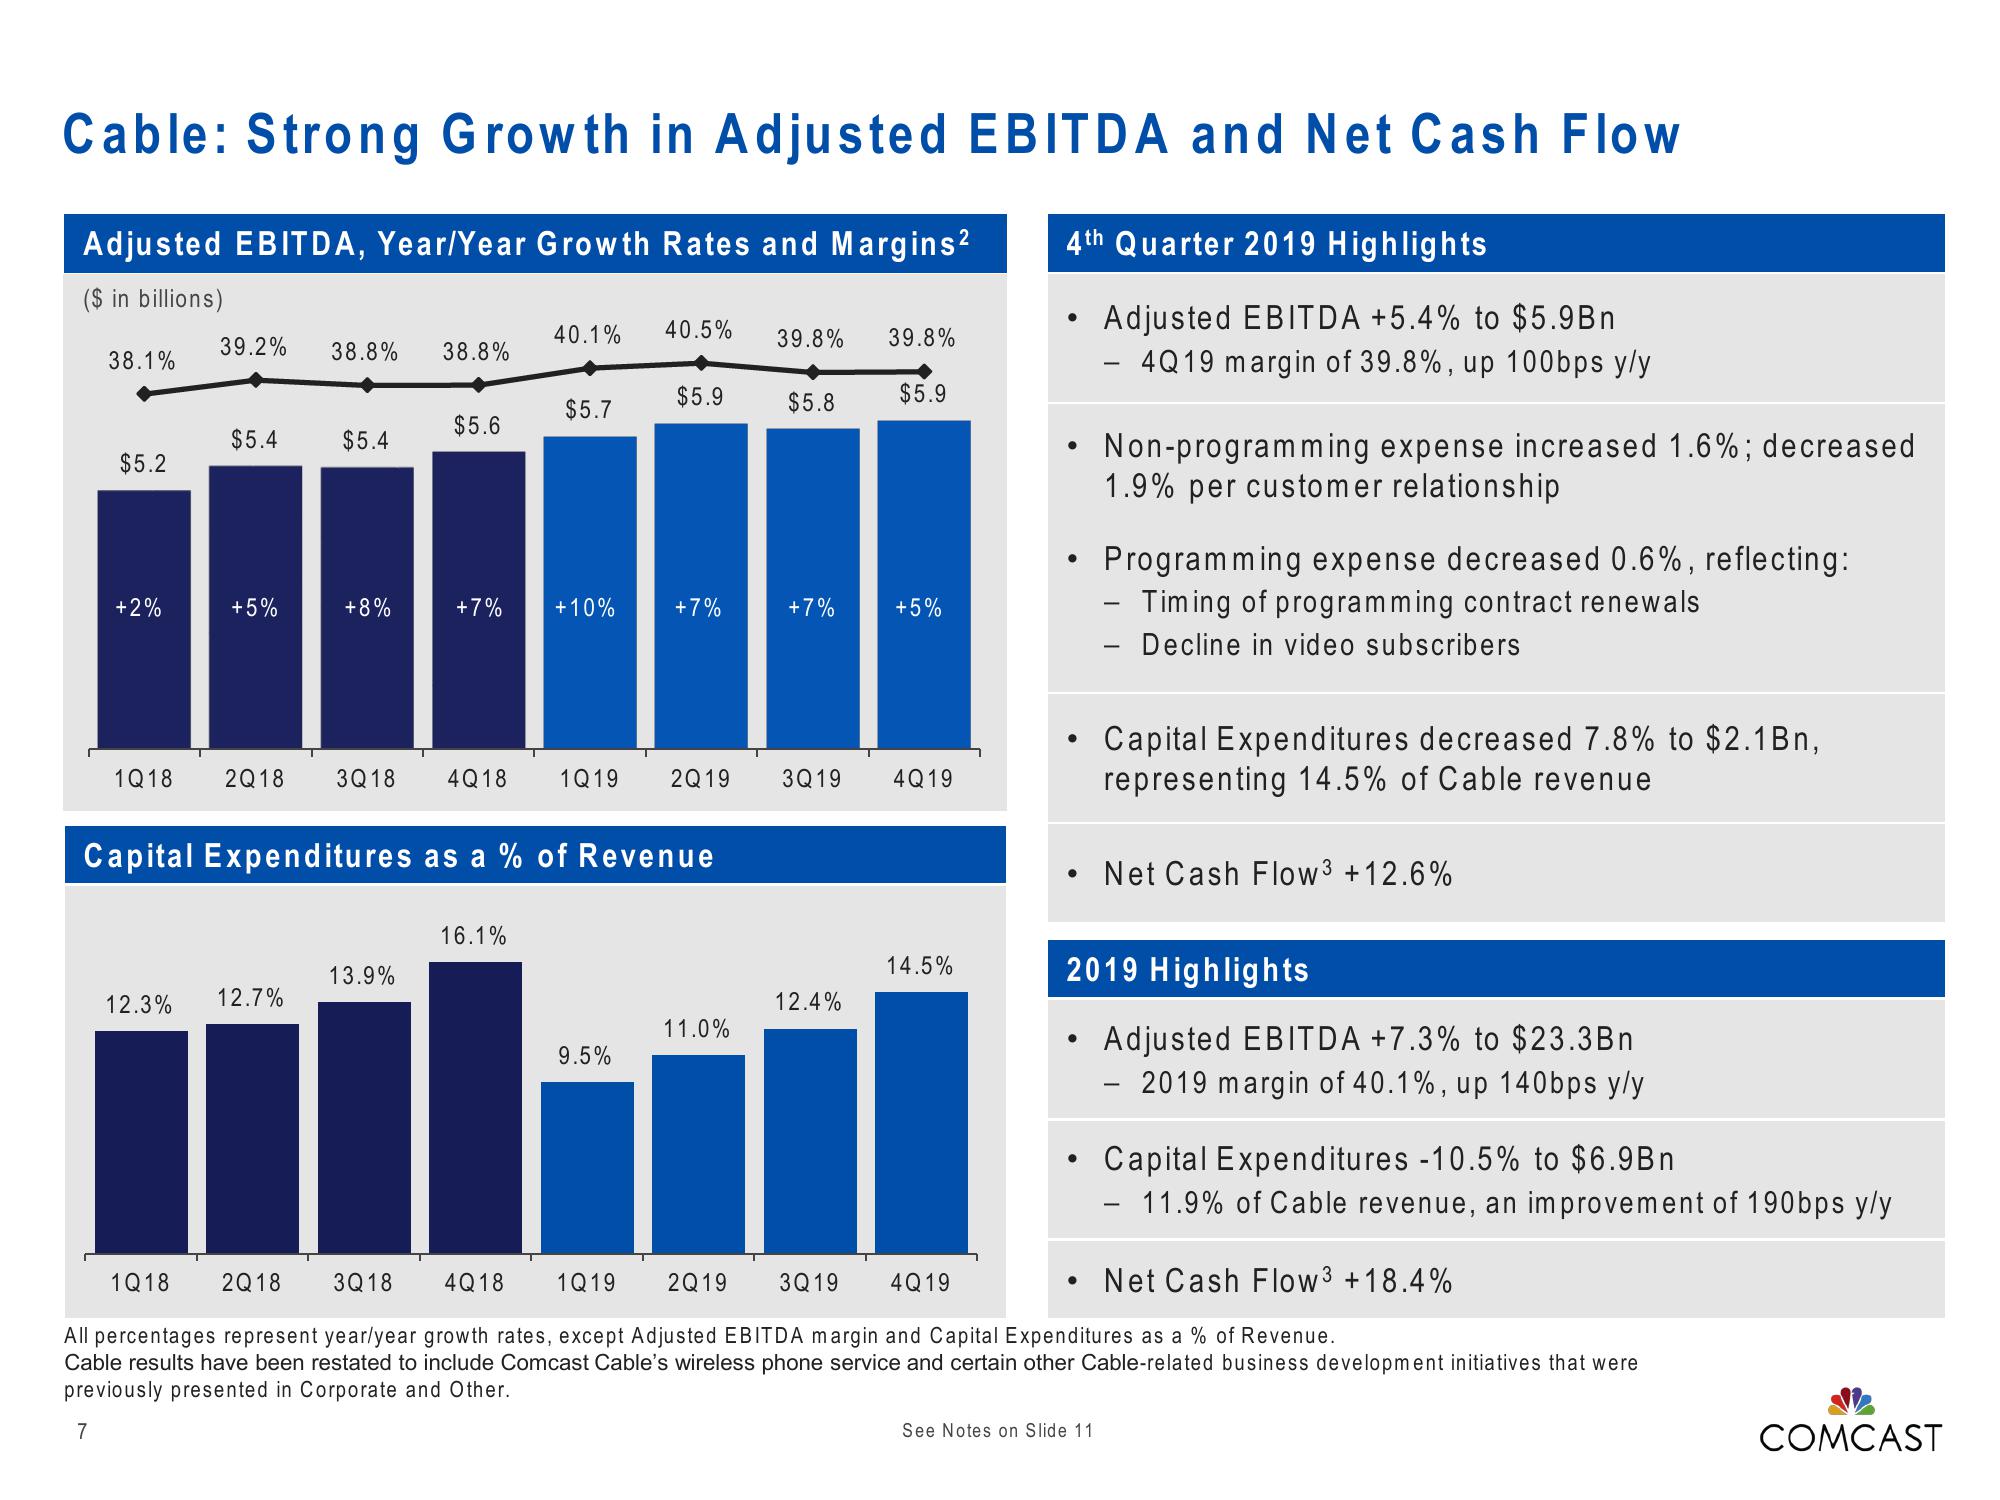
Cable: Strong Growth in Adjusted EBITDA and Net Cash Flow
Adjusted EBITDA, Year/Year Growth Rates and Margins²
($ in billions)
38.1%
$5.2
+2%
1Q18
39.2%
$5.4
+5%
38.8% 38.8%
$5.4
12.3% 12.7%
+8%
$5.6
+7%
13.9%
40.1% 40.5%
$5.7
16.1%
+10%
Capital Expenditures as a % of Revenue
$5.9
+7%
2Q18 3Q18 4Q18 1Q19 2Q19 3Q19
9.5%
39.8% 39.8%
$5.9
11.0%
$5.8
+7%
12.4%
+5%
4Q19
14.5%
4th Quarter 2019 Highlights
Adjusted EBITDA +5.4% to $5.9Bn
4Q19 margin of 39.8%, up 100bps y/y
●
●
Non-programming expense increased 1.6%; decreased
1.9% per customer relationship
Programming expense decreased 0.6%, reflecting:
- Timing of programming contract renewals
Decline in video subscribers
See Notes on Slide 11
-
Capital Expenditures decreased 7.8% to $2.1 Bn,
representing 14.5% of Cable revenue
Net Cash Flow³ +12.6%
2019 Highlights
Adjusted EBITDA +7.3% to $23.3Bn
- 2019 margin of 40.1%, up 140bps y/y
Capital Expenditures -10.5% to $6.9Bn
11.9% of Cable revenue, an improvement of 190bps y/y
1Q18
2Q18 3Q18 4Q18 1Q19 2Q19 3Q19 4Q19
Net Cash Flow³ +18.4%
All percentages represent year/year growth rates, except Adjusted EBITDA margin and Capital Expenditures as a % of Revenue.
Cable results have been restated to include Comcast Cable's wireless phone service and certain other Cable-related business development initiatives that were
previously presented in Corporate and Other.
7
COMCASTView entire presentation