Disney Results Presentation Deck slide image

Disney Results Presentation Deck

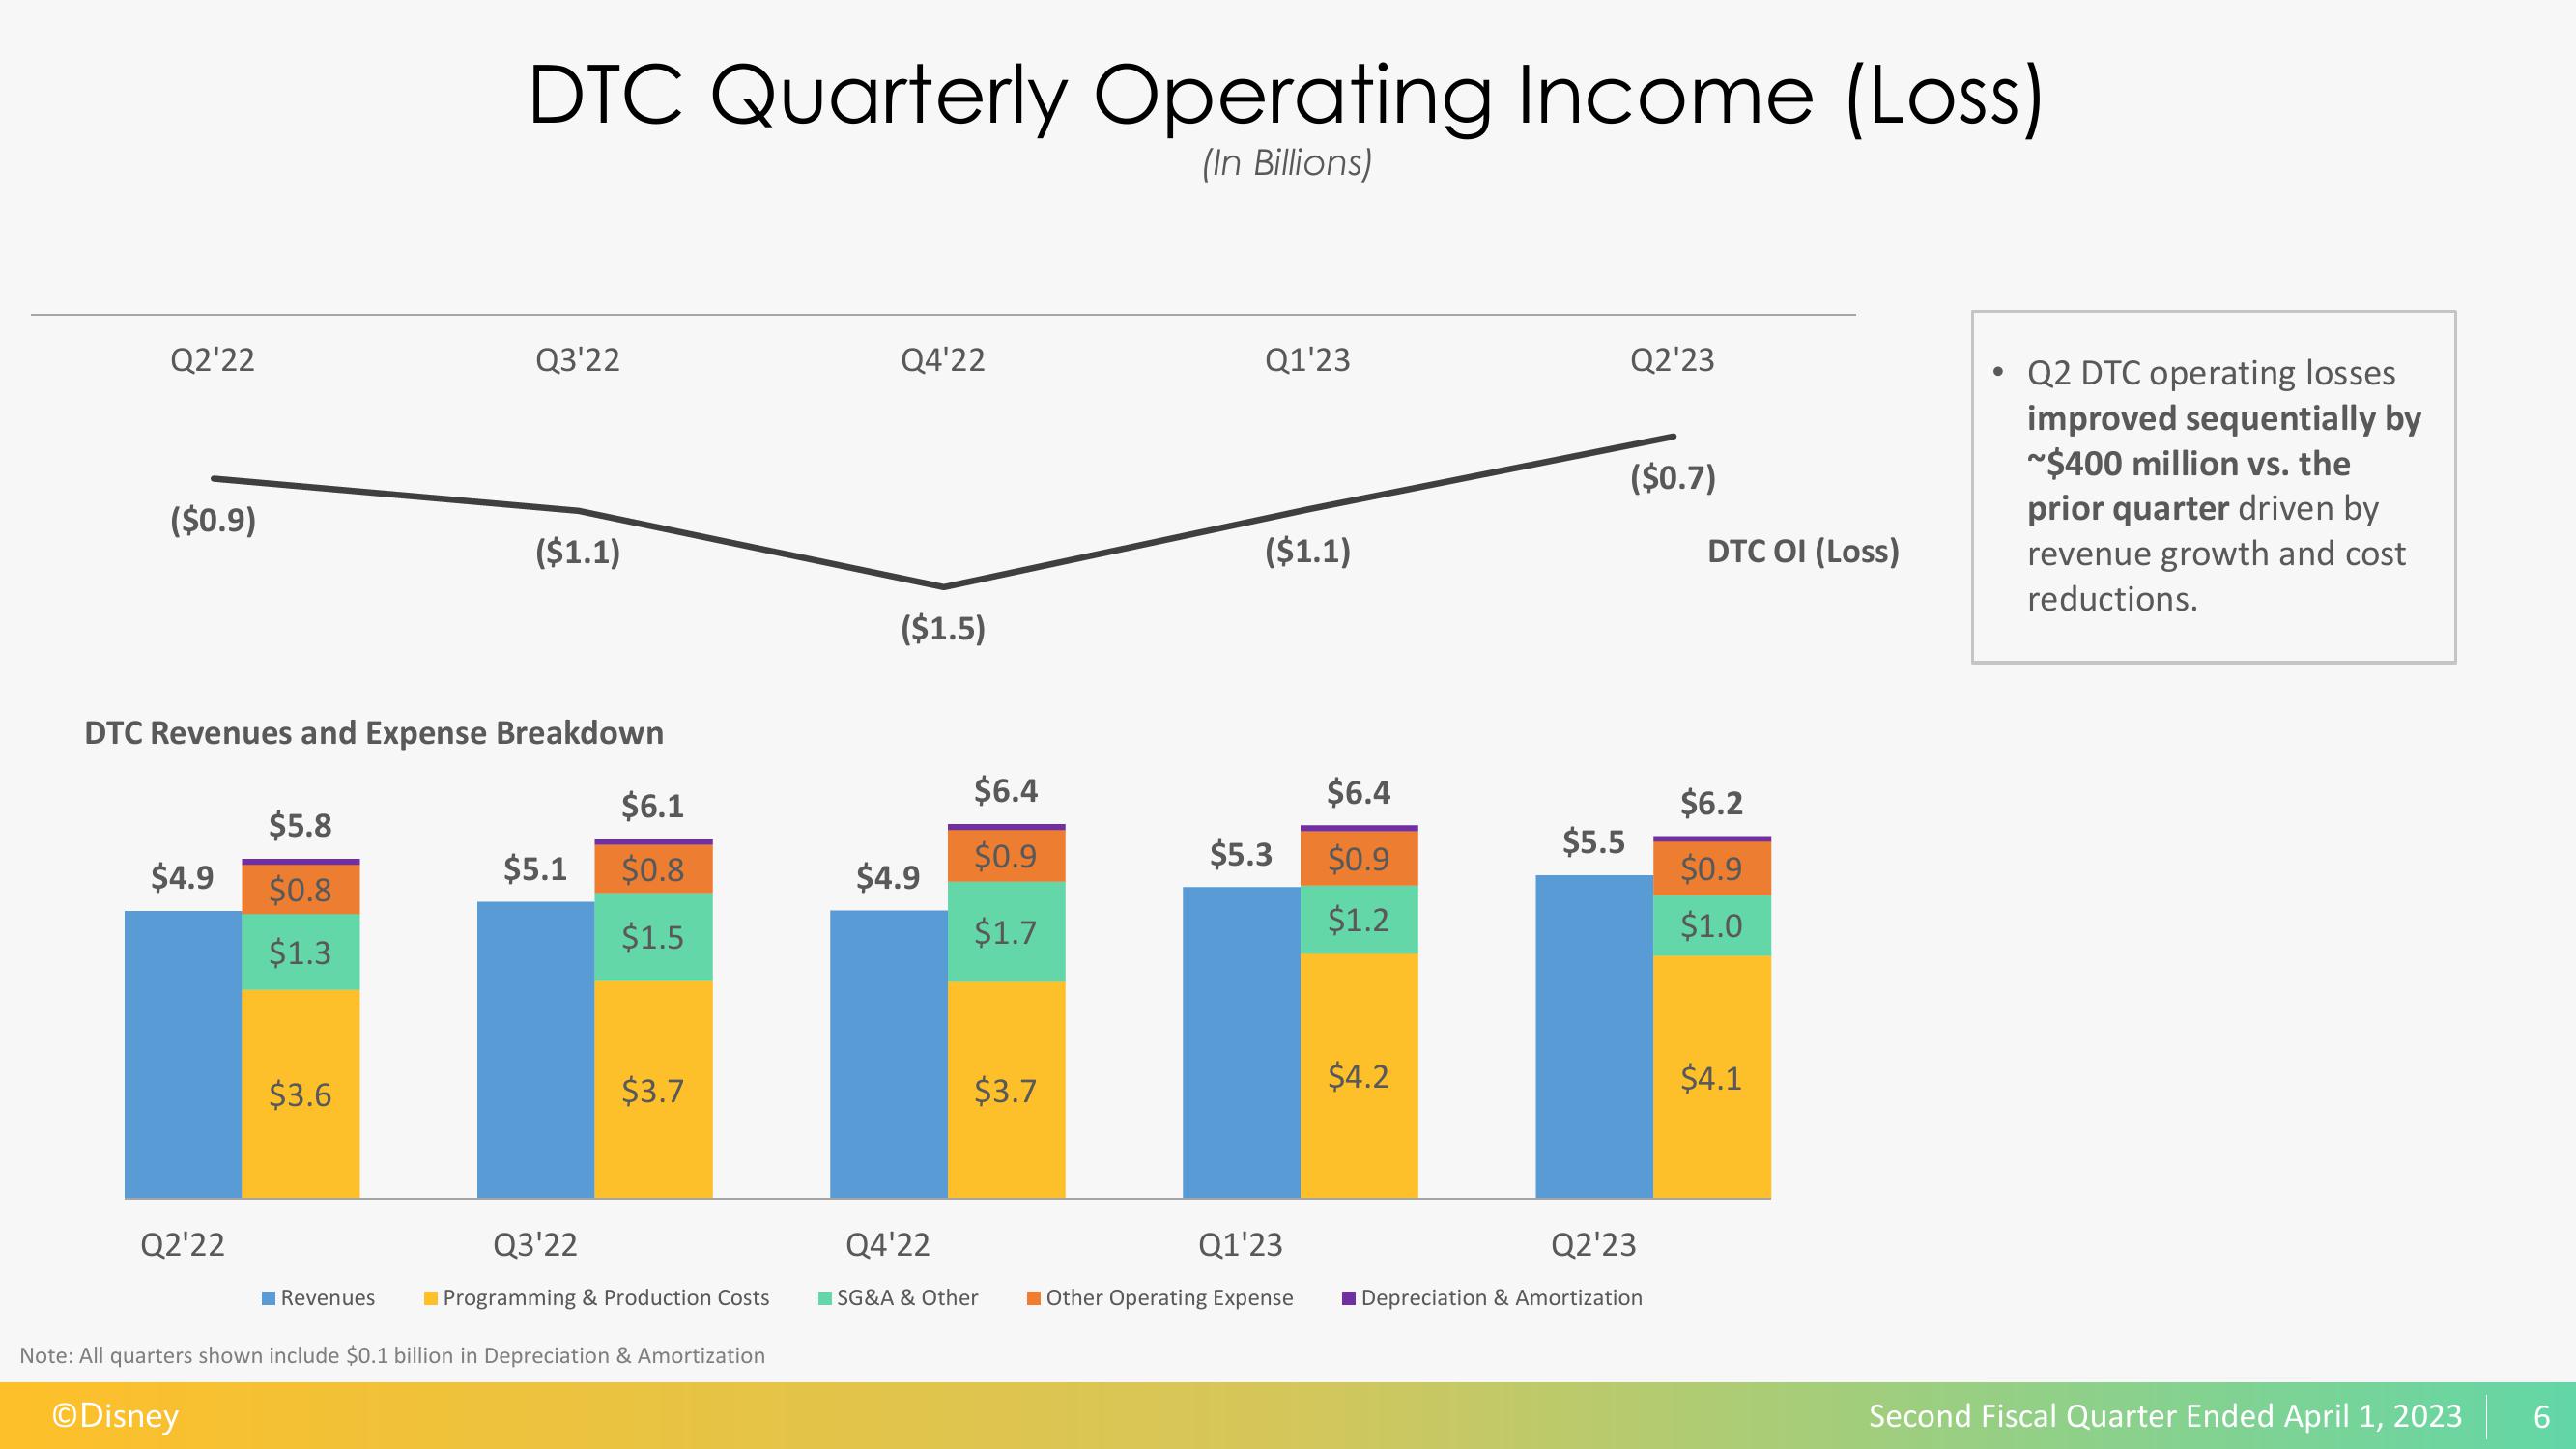
Q2'22 ($0.9) $4.9 Q2'22 DTC Revenues and Expense Breakdown $5.8 $0.8 $1.3 $3.6 DTC Quarterly Operating Income (Loss) (In Billions) Revenues Q3'22 ($1.1) $5.1 $6.1 $0.8 $1.5 $3.7 Q3'22 Programming & Production Costs Note: All quarters shown include $0.1 billion in Depreciation & Amortization ⒸDisney Q4'22 ($1.5) $4.9 $6.4 $0.9 $1.7 $3.7 Q4'22 SG&A & Other Q1'23 ($1.1) $5.3 Q1'23 Other Operating Expense $6.4 $0.9 $1.2 $4.2 Q2'23 ($0.7) $5.5 Q2'23 Depreciation & Amortization DTC OI (Loss) $6.2 $0.9 $1.0 $4.1 Q2 DTC operating losses improved sequentially by ~$400 million vs. the prior quarter driven by revenue growth and cost reductions. Second Fiscal Quarter Ended April 1, 2023 6
View entire presentation