Sonos Results Presentation Deck
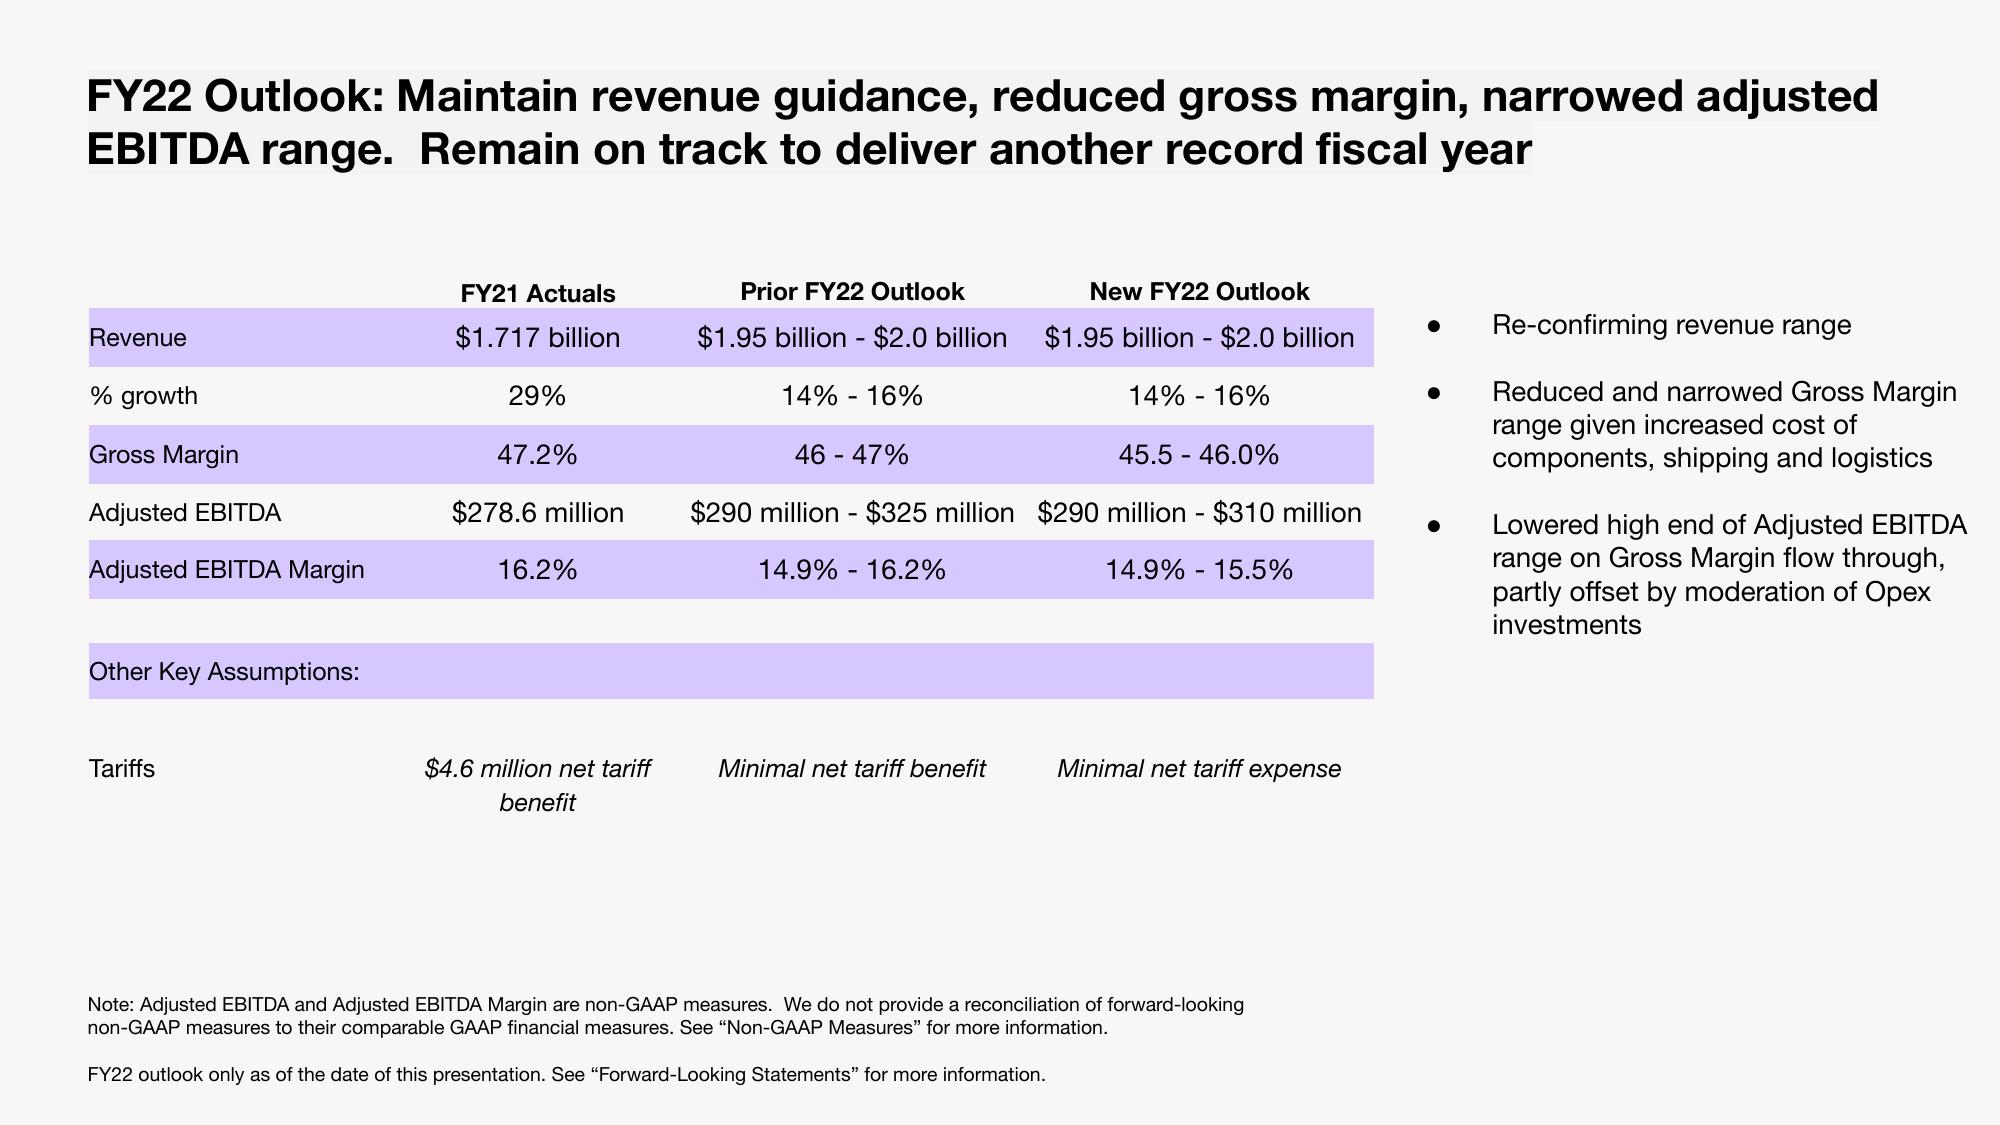
FY22 Outlook: Maintain revenue guidance, reduced gross margin, narrowed adjusted
EBITDA range. Remain on track to deliver another record fiscal year
Revenue
% growth
Gross Margin
Adjusted EBITDA
Adjusted EBITDA Margin
Other Key Assumptions:
Tariffs
FY21 Actuals
$1.717 billion
29%
47.2%
$278.6 million
16.2%
$4.6 million net tariff
benefit
Prior FY22 Outlook
$1.95 billion - $2.0 billion
14% -16%
46 - 47%
$290 million $325 million
14.9% -16.2%
Minimal net tariff benefit
New FY22 Outlook
$1.95 billion $2.0 billion
14% -16%
45.5 - 46.0%
$290 million - $310 million
14.9% - 15.5%
-
Minimal net tariff expense
Note: Adjusted EBITDA and Adjusted EBITDA Margin are non-GAAP measures. We do not provide a reconciliation of forward-looking
non-GAAP measures to their comparable GAAP financial measures. See "Non-GAAP Measures" for more information.
FY22 outlook only as of the date of this presentation. See "Forward-Looking Statements" for more information.
●
Re-confirming revenue range
Reduced and narrowed Gross Margin
range given increased cost of
components, shipping and logistics
Lowered high end of Adjusted EBITDA
range on Gross Margin flow through,
partly offset by moderation of Opex
investmentsView entire presentation