Netstreit IPO Presentation Deck
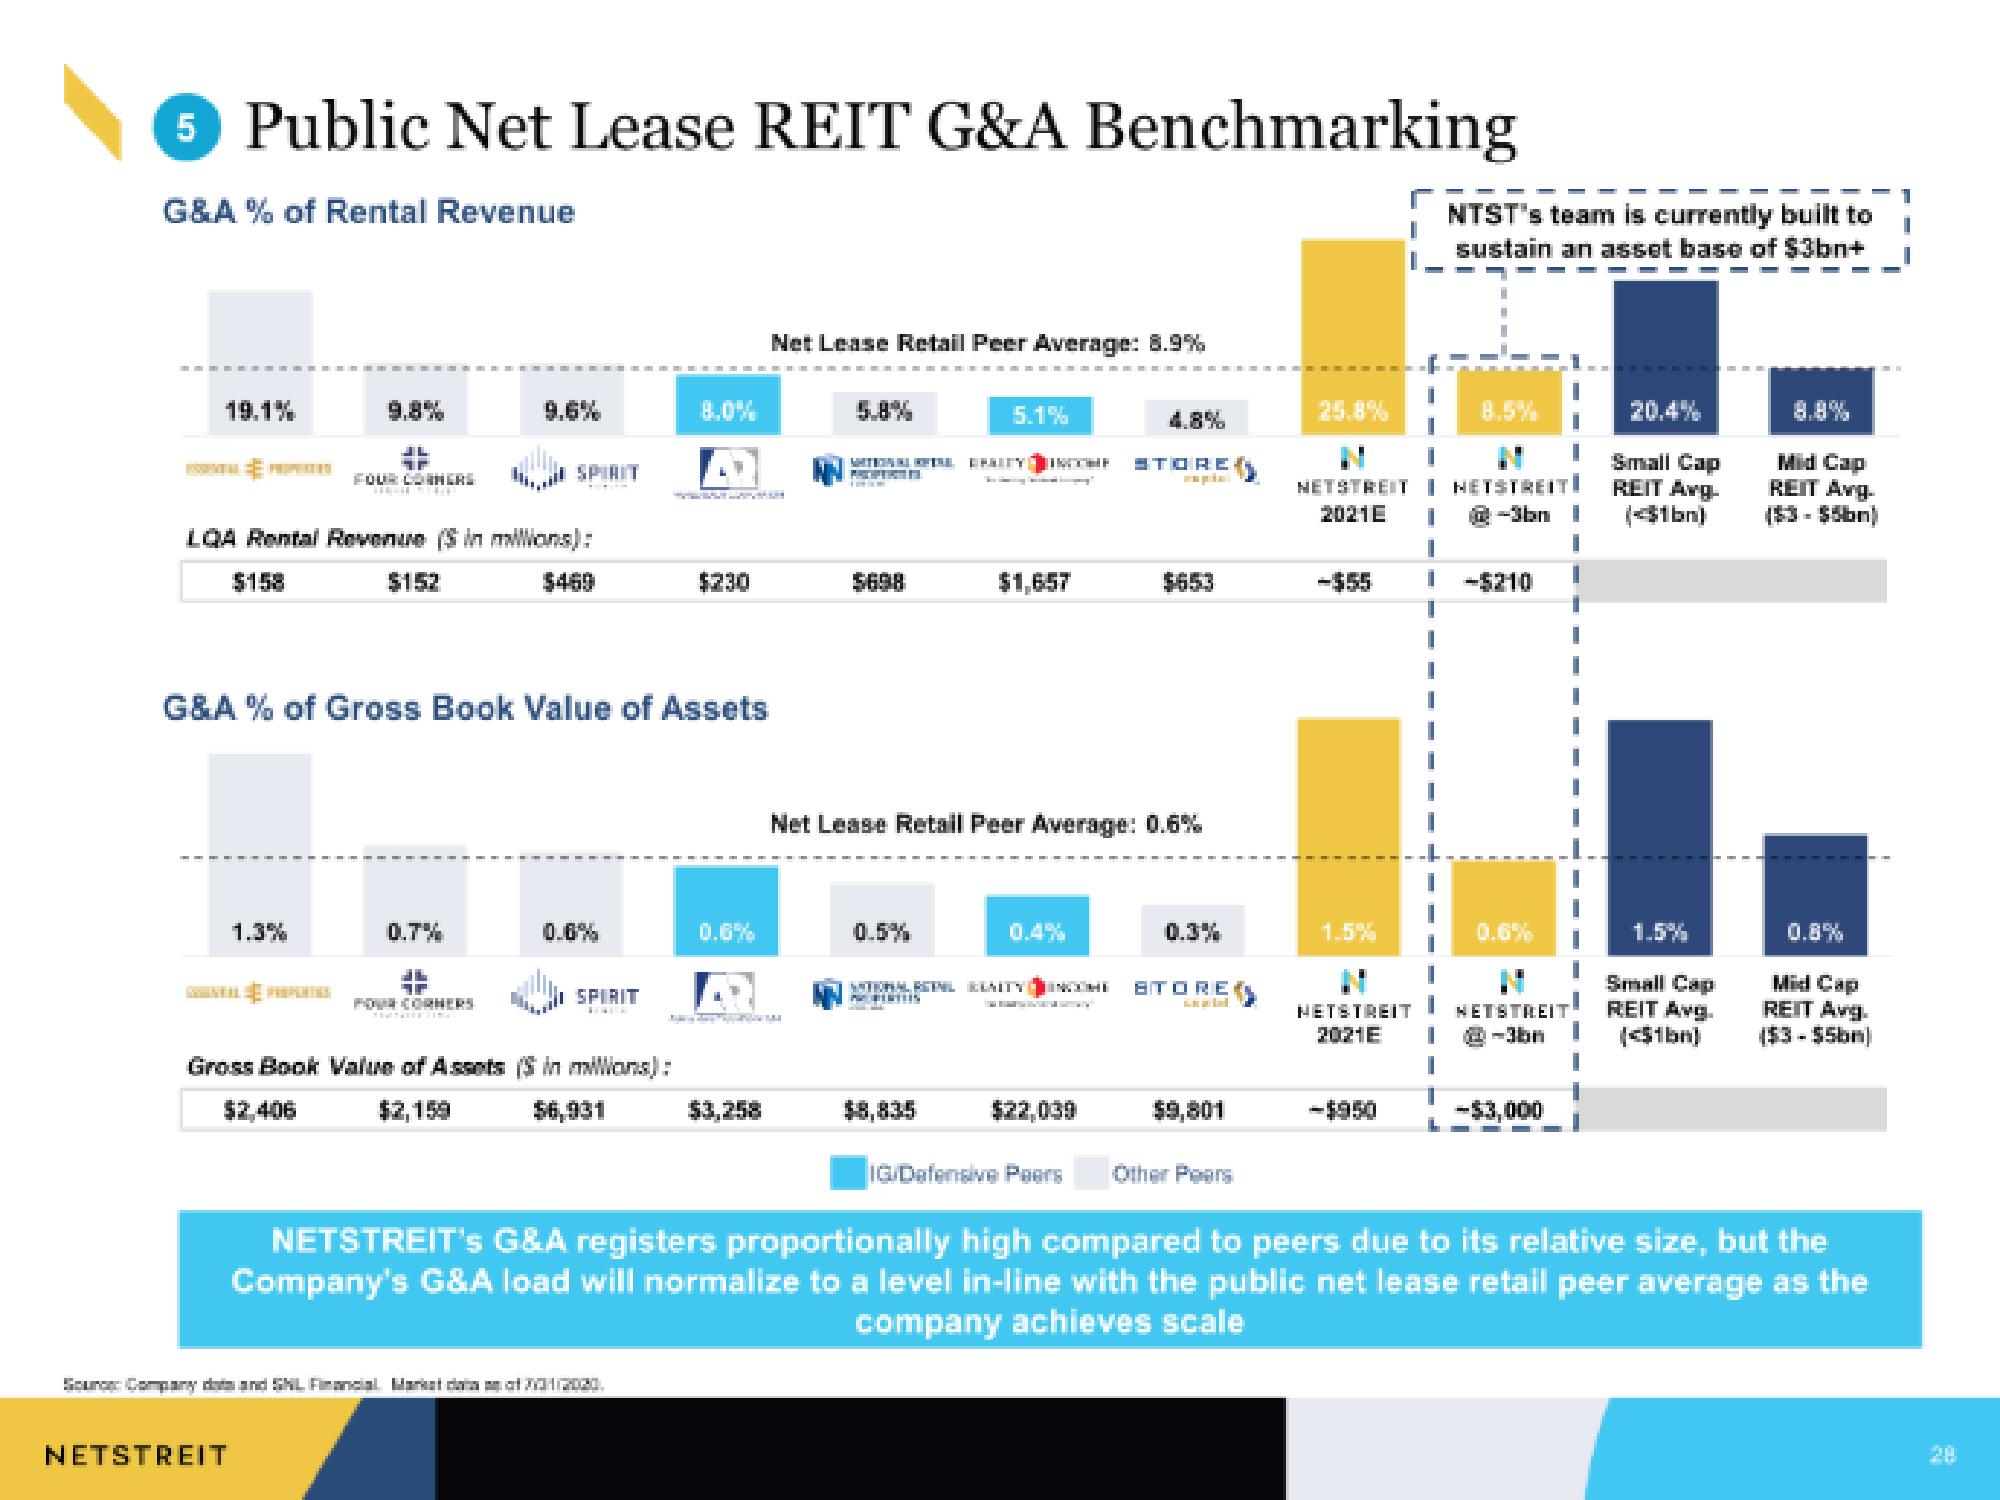
5 Public Net Lease REIT G&A Benchmarking
G&A % of Rental Revenue
19.1%
JL
FOUR CORNERS
TECH STET
LQA Rental Revenue (Sin millions):
$158
$152
$469
1.3%
NETSTREIT
SPIRIT
G&A % of Gross Book Value of Assets
0.7%
EF
FOUR CORNERS
Toalerine
0.6%
SPIRIT
Gross Book Value of Assets (S in mans):
$2,406
$2,159
$6,931
Sour Company data and SNL Financial Market dana 2011(22020.
ALER
$230
0.6%
A
Net Lease Retail Peer Average: 8.9%
$3,258
$698
MTGADE OF KIL ERSITY INETHE STORE
HATIKAN
5.1%
0.5%
$1,657
$8,835
4.8%
Net Lease Retail Peer Average: 0.6%
$653
$22,039
NATIONAL RETNL KLAITY INCOME STORE
PROPERTIES
0.3%
$9,801
IG/Defensive Peers Other Pears
25.8%
NETSTREIT | NETSTREIT!
2021E | @-3bn 1
I
-$55
1.5%
NTST's team is currently built to
sustain an asset base of $3bn+
-$950
I
i -$210
0.6%
NETSTREIT NETSTREIT
2021E I @-3bn
I
-$3,000
Small Cap
REIT Avg-
(<$1bn)
1.5%
Small Cap
REIT Avg.
(<$1bn)
Mid Cap
REIT Avg-
0.8%
Mid Cap
REIT Avg.
($3-$5bm)
NETSTREIT's G&A registers proportionally high compared to peers due to its relative size, but the
Company's G&A load will normalize to a level in-line with the public net lease retail peer average as the
company achieves scaleView entire presentation