dLocal Investor Day Presentation Deck
Share of TPV
Share of revenues
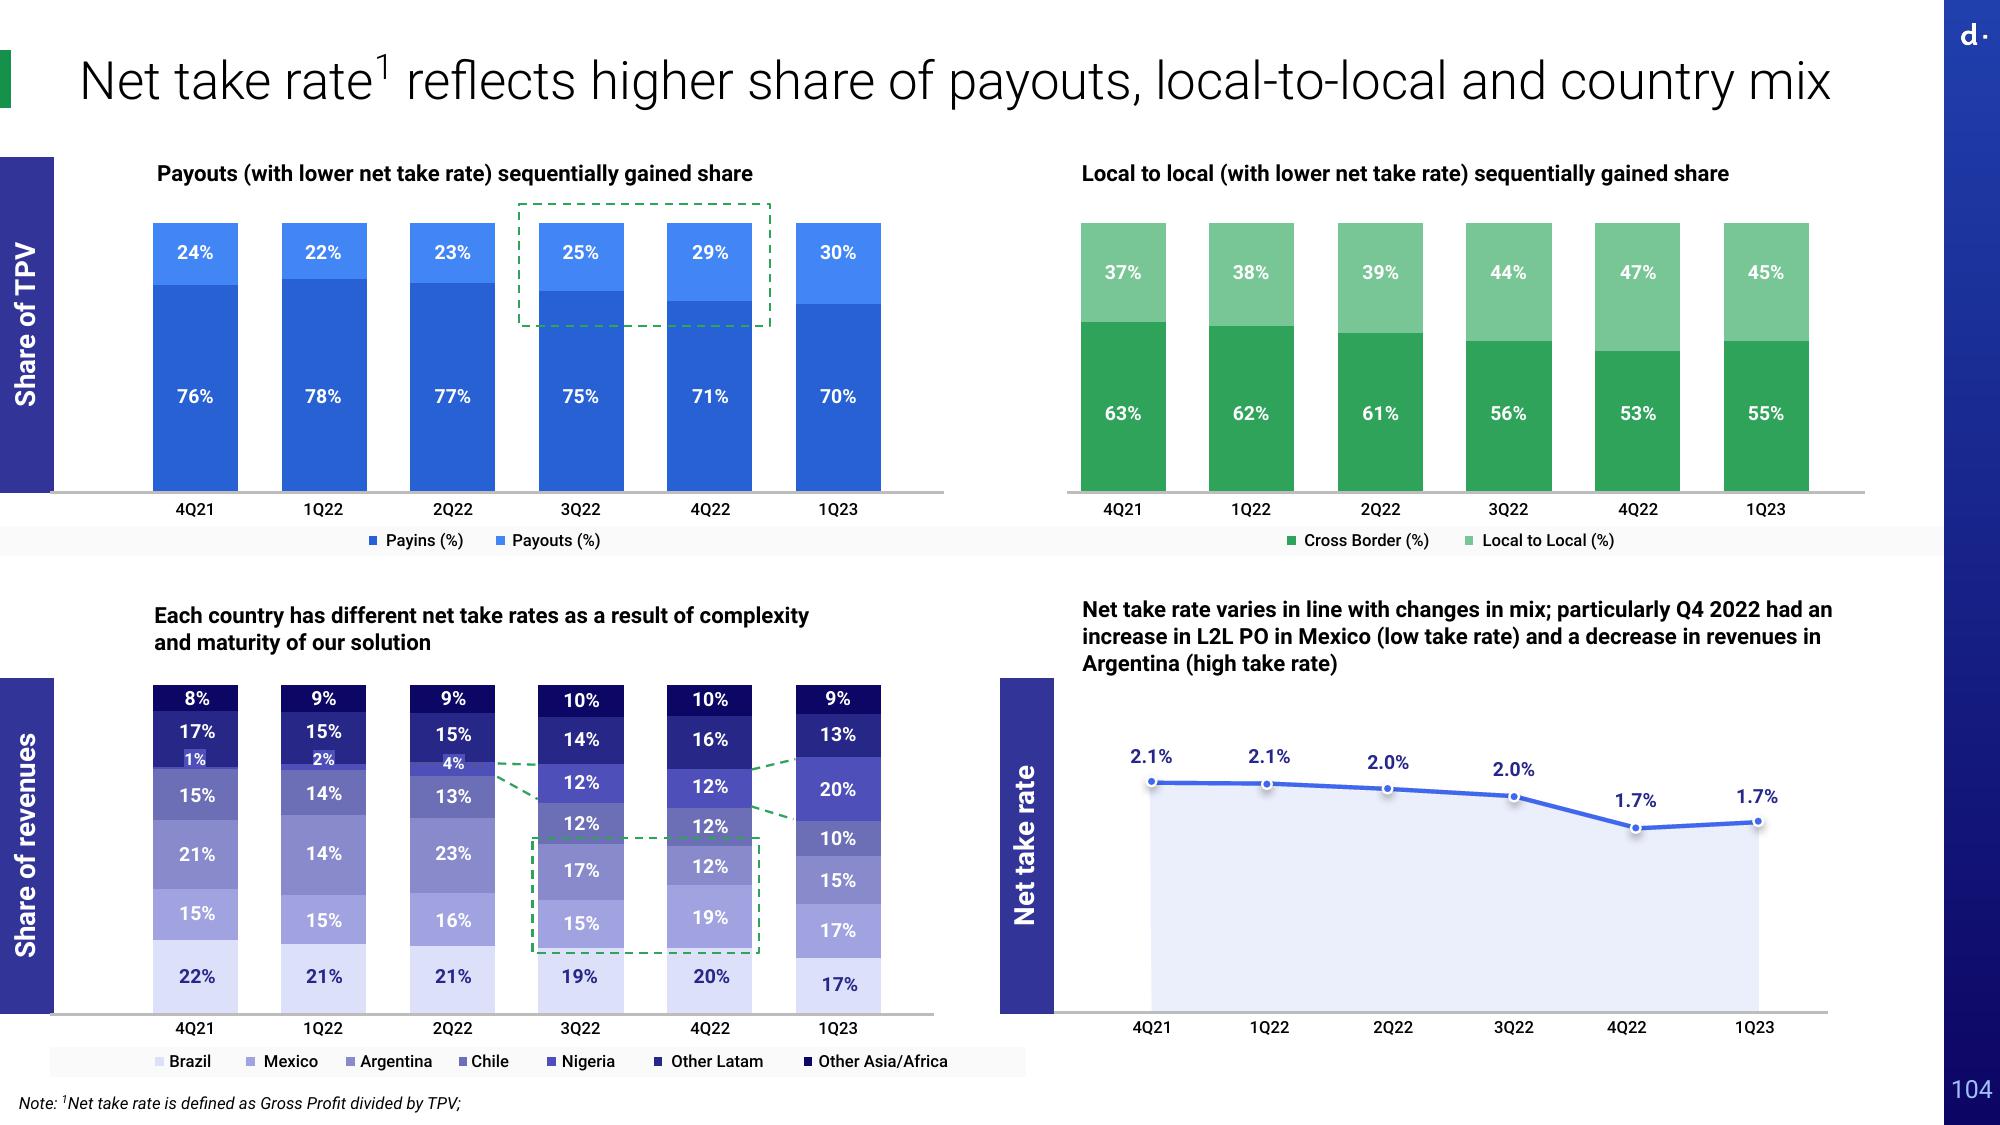
Net take rate¹ reflects higher share of payouts, local-to-local and country mix
Payouts (with lower net take rate) sequentially gained share
24%
76%
4Q21
8%
17%
1%
15%
21%
15%
22%
22%
4Q21
Brazil
78%
1Q22
9%
15%
2%
14%
14%
15%
Each country has different net take rates as a result of complexity
and maturity of our solution
21%
1Q22
Mexico
23%
77%
Argentina
2Q22
3Q22
■ Payins (%) ■ Payouts (%)
9%
15%
4%
13%
23%
16%
21%
2Q22
25%
Note: ¹Net take rate is defined as Gross Profit divided by TPV;
75%
Chile
10%
14%
12%
12%
17%
15%
19%
29%
3Q22
■ Nigeria
71%
4Q22
10%
16%
12%
12%
12%
19%
20%
4Q22
T
Other Latam
30%
70%
1Q23
9%
13%
20%
10%
15%
17%
17%
1Q23
■ Other Asia/Africa
Net take rate
Local to local (with lower net take rate) sequentially gained share
37%
63%
4Q21
2.1%
38%
4Q21
62%
1Q22
39%
2022
■ Cross Border (%)
2.1%
61%
1Q22
2.0%
44%
2022
56%
3Q22
■Local to Local (%)
Net take rate varies in line with changes in mix; particularly Q4 2022 had an
increase in L2L PO in Mexico (low take rate) and a decrease in revenues in
Argentina (high take rate)
2.0%
47%
3Q22
53%
4Q22
1.7%
45%
4Q22
55%
1Q23
1.7%
1Q23
d.
104View entire presentation